Analytics: Messages Sent
The Messages Sent chart provides information on overall message volume and success rates. You can also drill into individual message formulas, labels, channel, and more.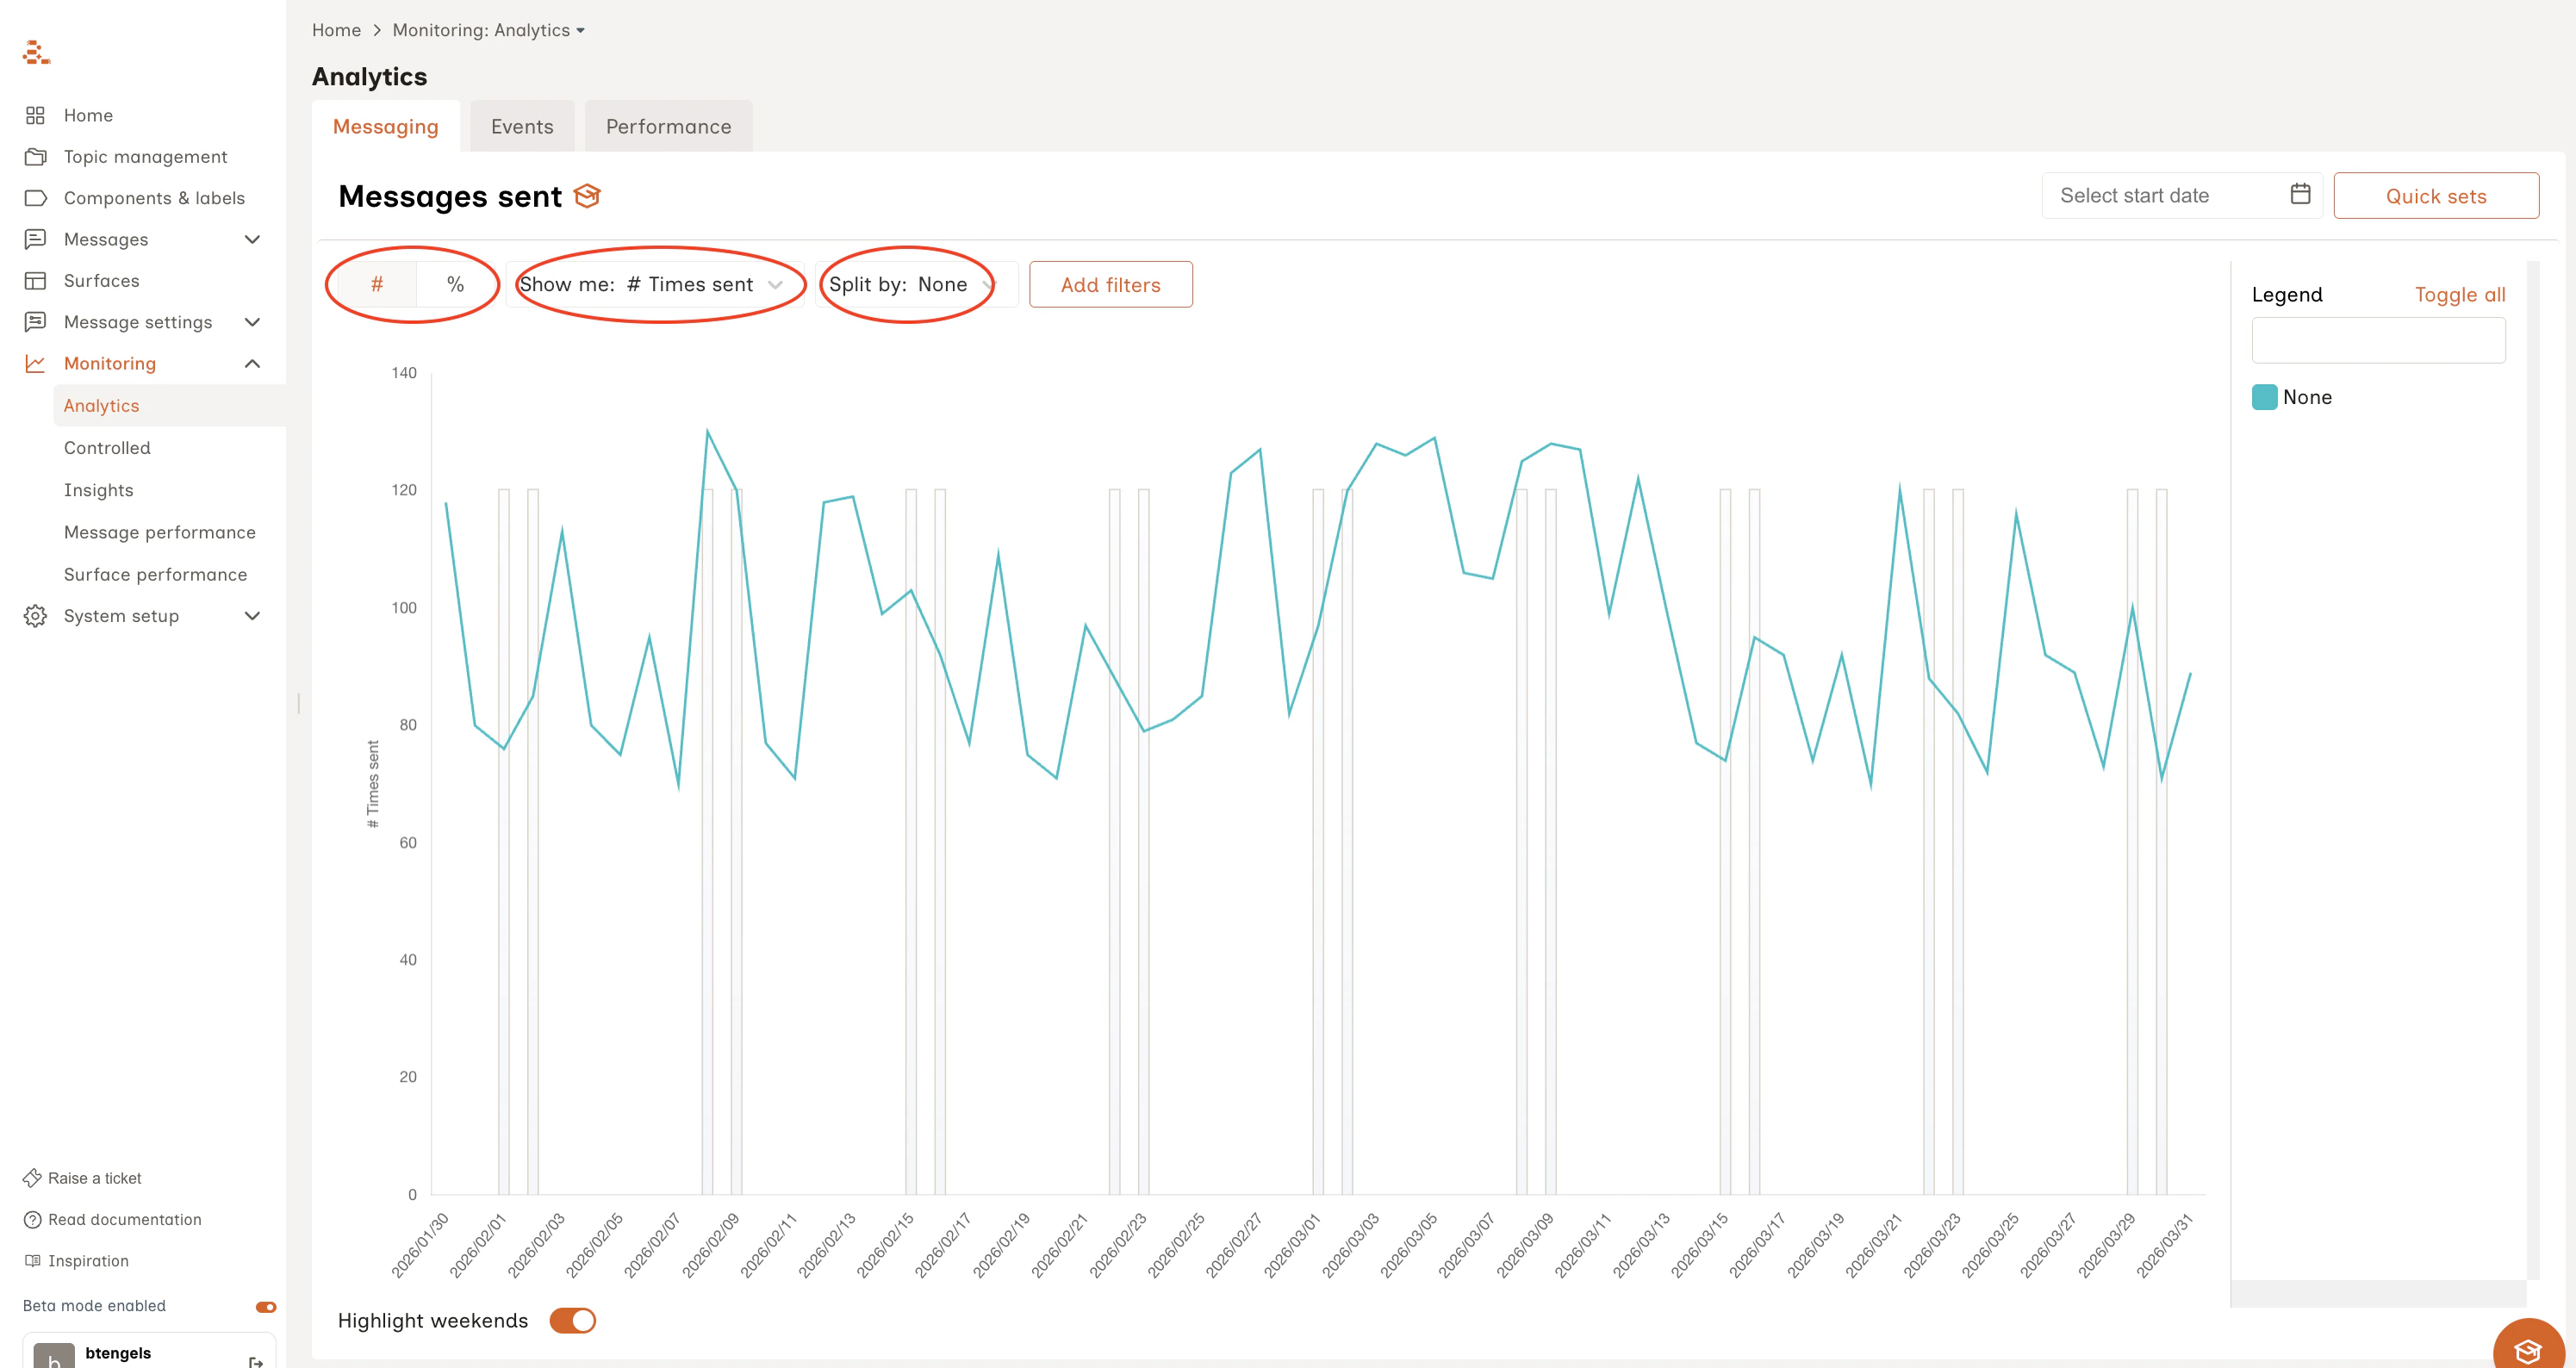
- How many messages are being sent every day for each channel?
- What messages are sent the most/least on a given day?
- How are messages balanced across different labels?
To see Aampe’s “success rate” click on the % sign at the top left.
Success rate is defined as the number of successful events divided by the total number of messages sent for the current week.
Success rate is defined as the number of successful events divided by the total number of messages sent for the current week.
Analytics: Performance
To drill into the specific outcomes of messages, refer to the Performance tab. Choose a group of events (based on the Funnel categorization) along with any subset of message formulas to see (1) the number of events that were potentially influenced by Aampe messages or (2) the percent of messages led to a particular event.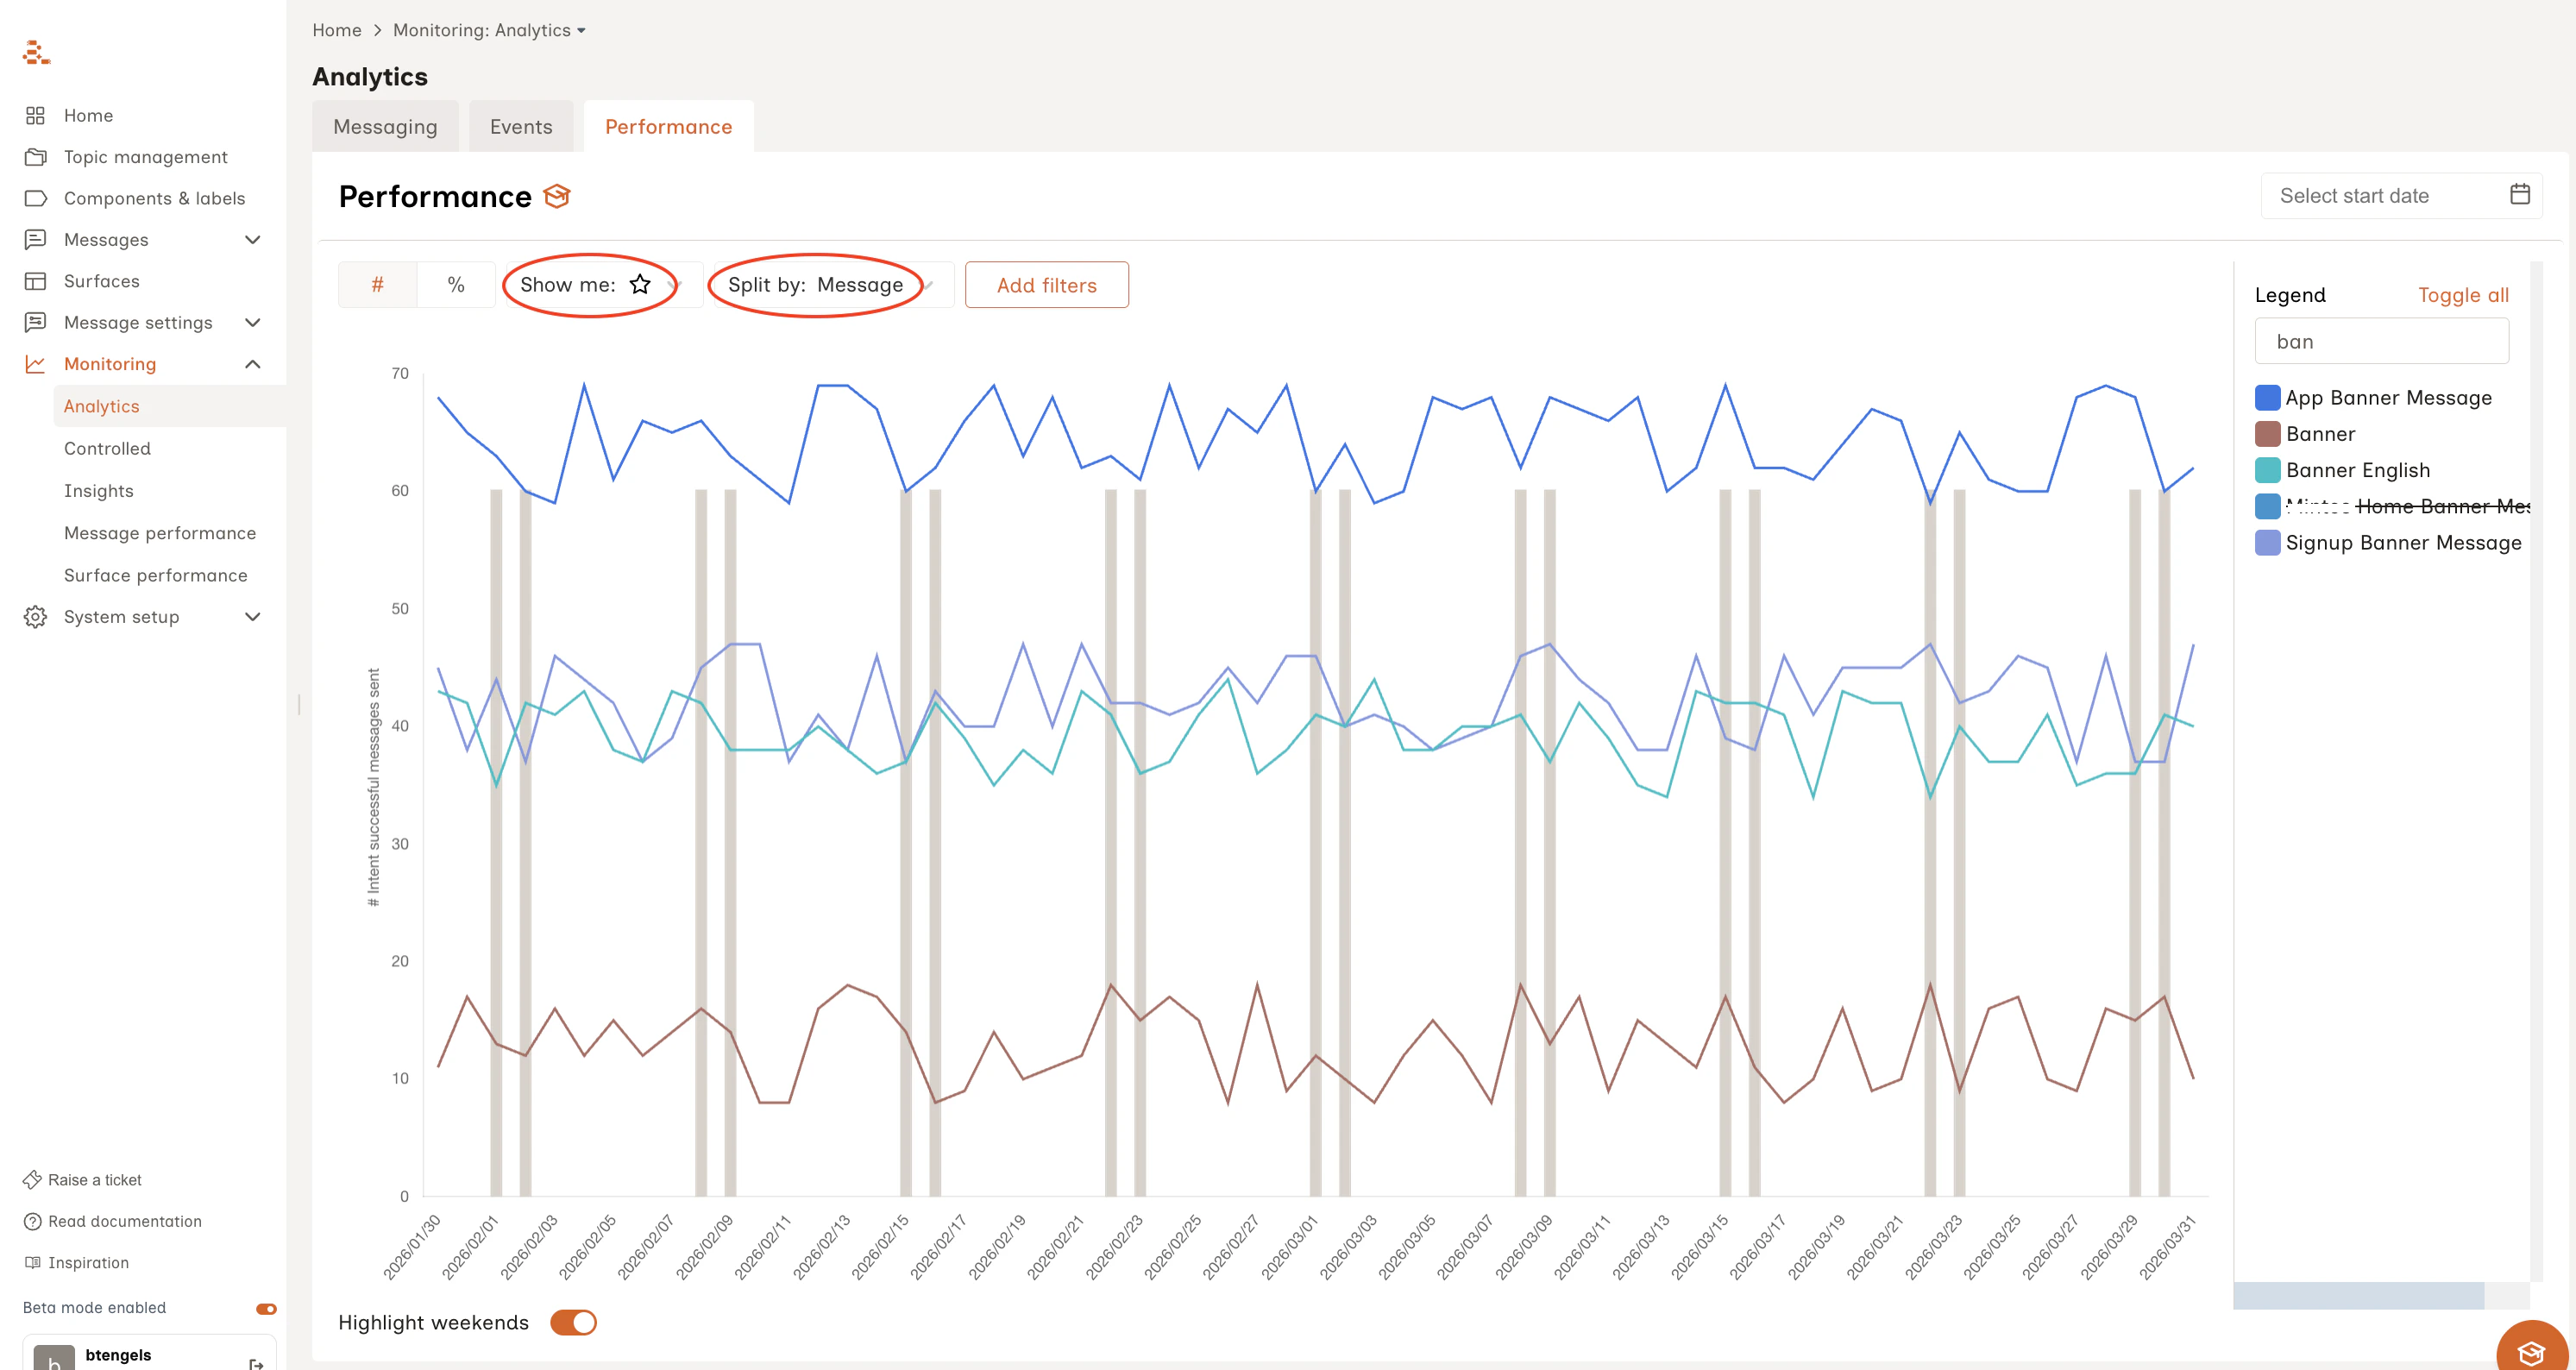
Insights: Frequency Tracker
There’s no one-size-fits-all answer to how often users want to hear from you. Some users thrive with five messages a week, others churn if you send more than two. The Frequency Tracker shows what share of users received a specific number (or range) or messages each week.Currently, agents monitor frequency based on a rolling 7-day window while reporting via the Frequency Tracker is based on a calendar week. At times this means the Frequency Tracker will show a small subset of users receiving more messages than they should be allowed.
Insights: Message Scheduler
The Message Scheduler tracks how users engage with messages to identify their ideal send times. This dashboard shows how agents learn and adapt over time — eliminating guesswork by testing and adjusting delivery windows based on real performance.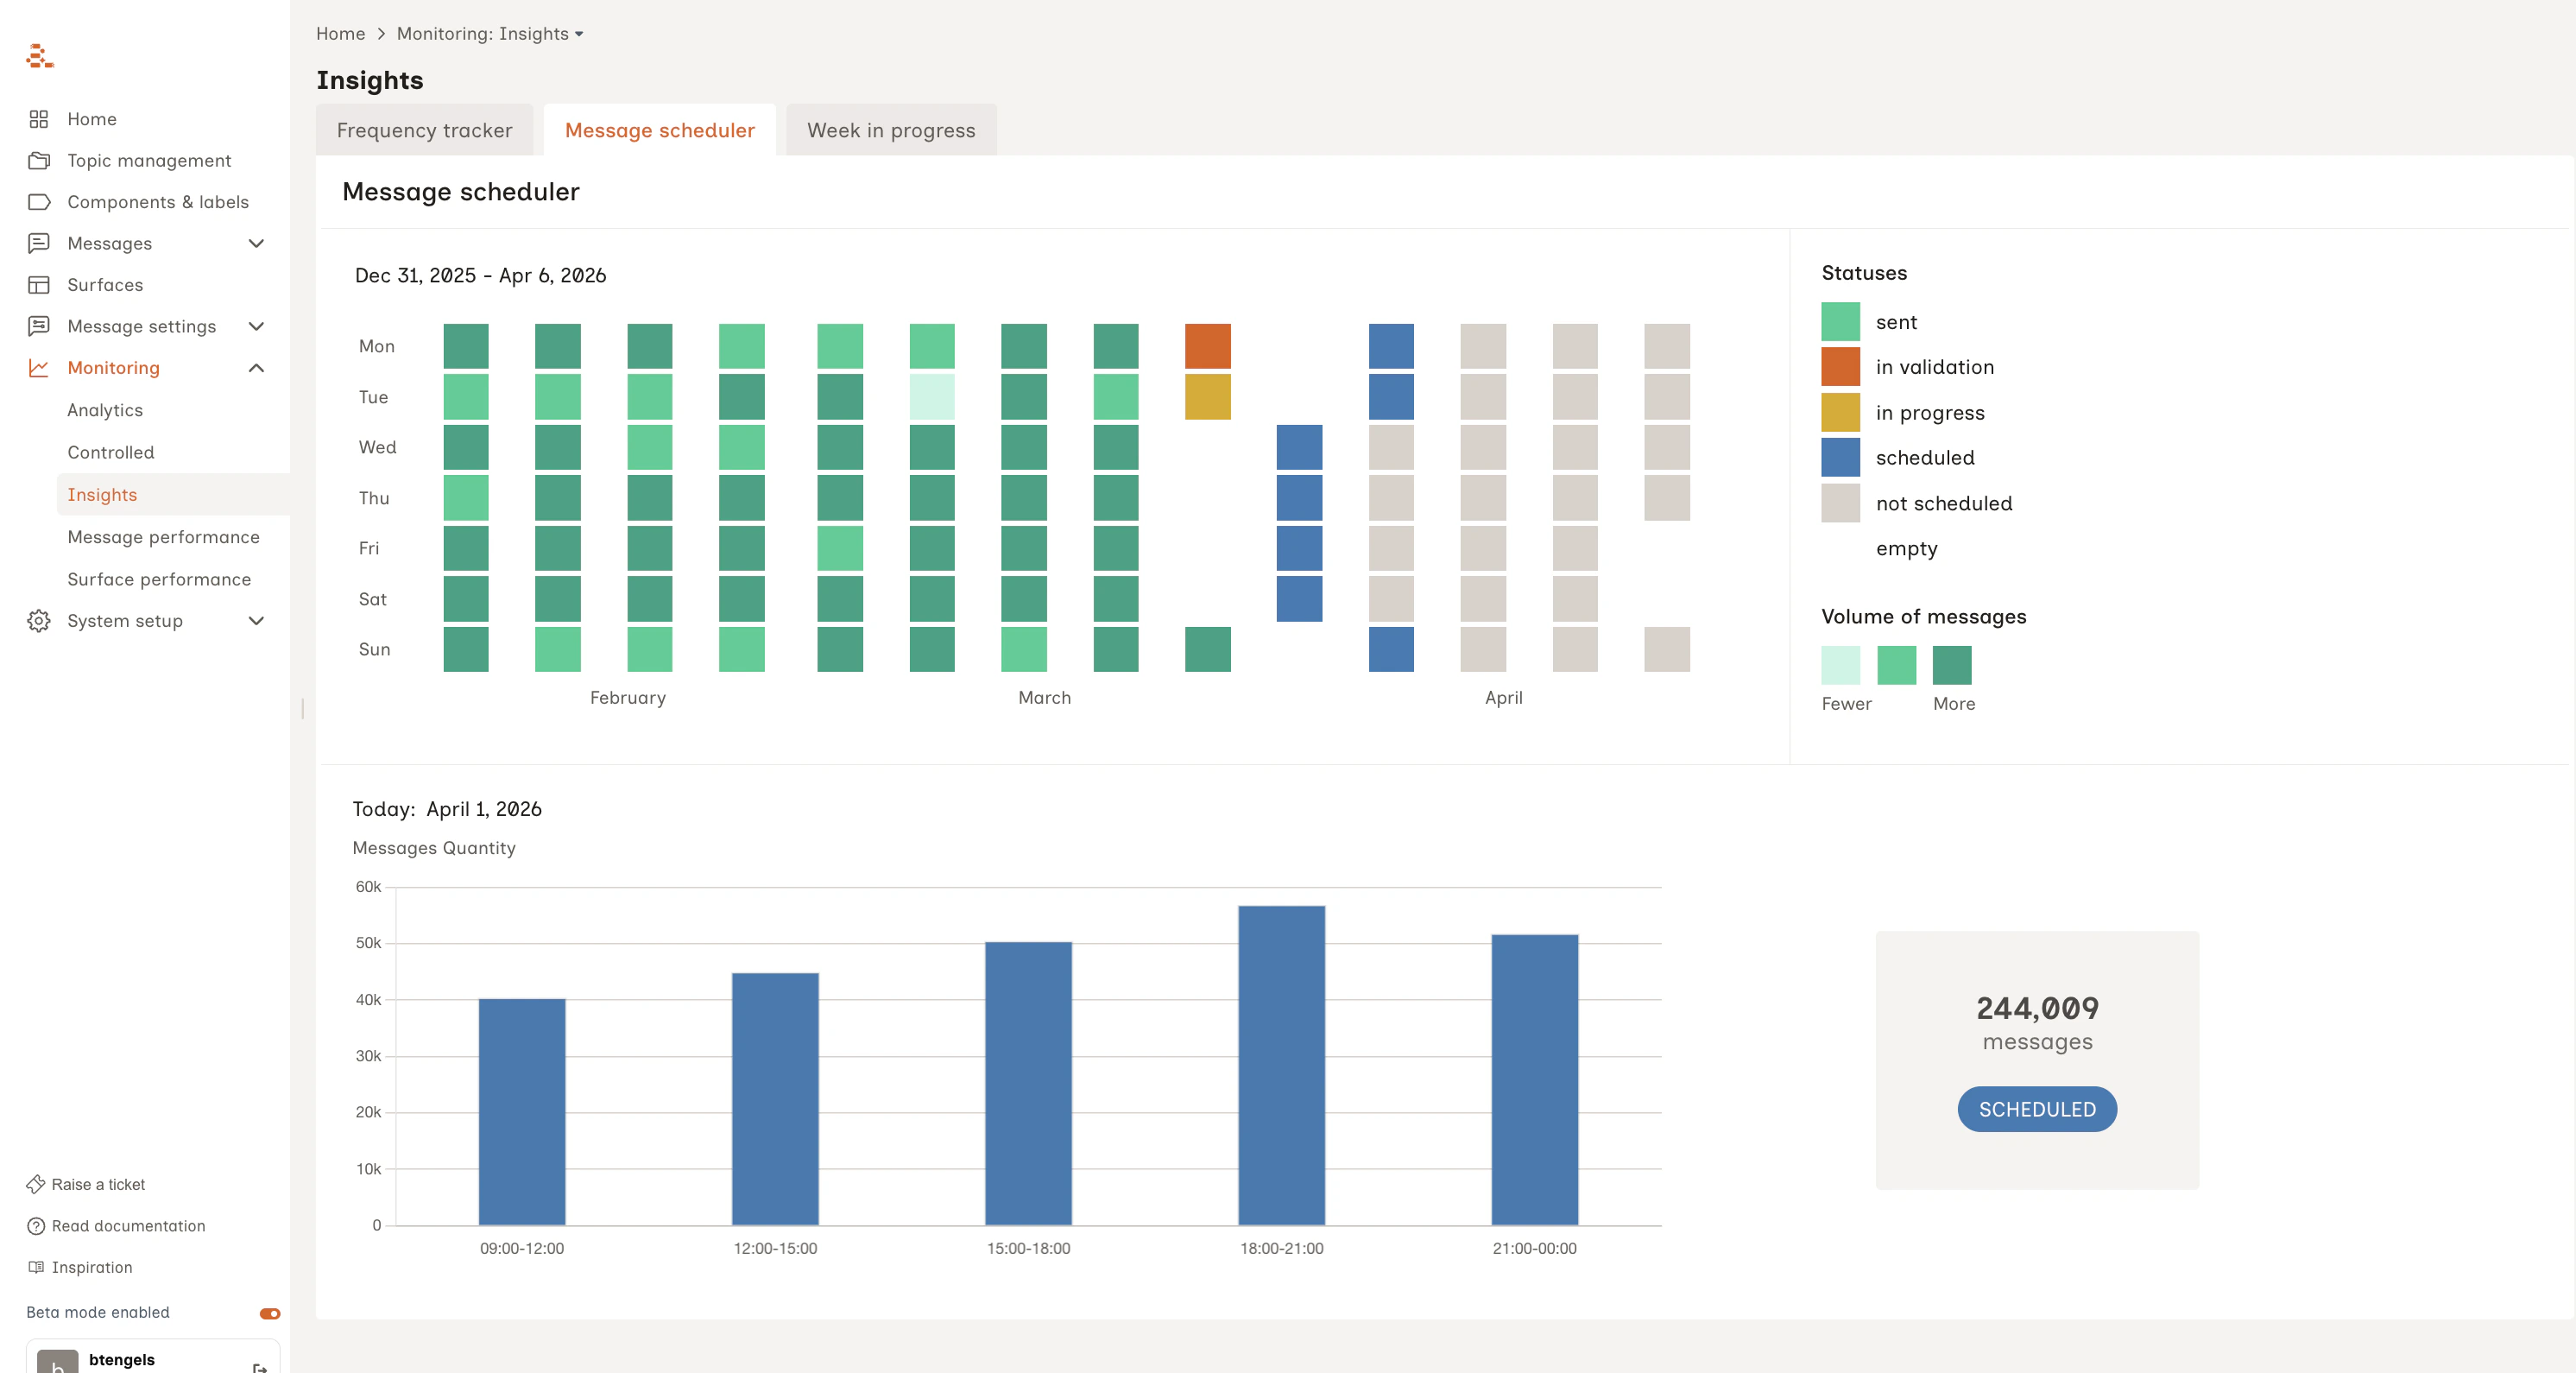
- Sent: Messages are sent and validated
- In Validation: Waiting for message delivery confirmation
- In Progress: Actively sending messages
- Scheduled: Messages slotted for future delivery
- Not Scheduled: The day has not yet entered the scheduling window
- Empty: No messages scheduled for that day. Time to add more content!
Scheduled messages: agents make plans in pencil before making a real-time decision about whether to send a message and if so, what message to send.
Insights: Week in Progress
The Week in Progress tag zooms in on the current week, showing you scheduled and sent messages for each day of the week and each 3-hour time bucket in the day (local time).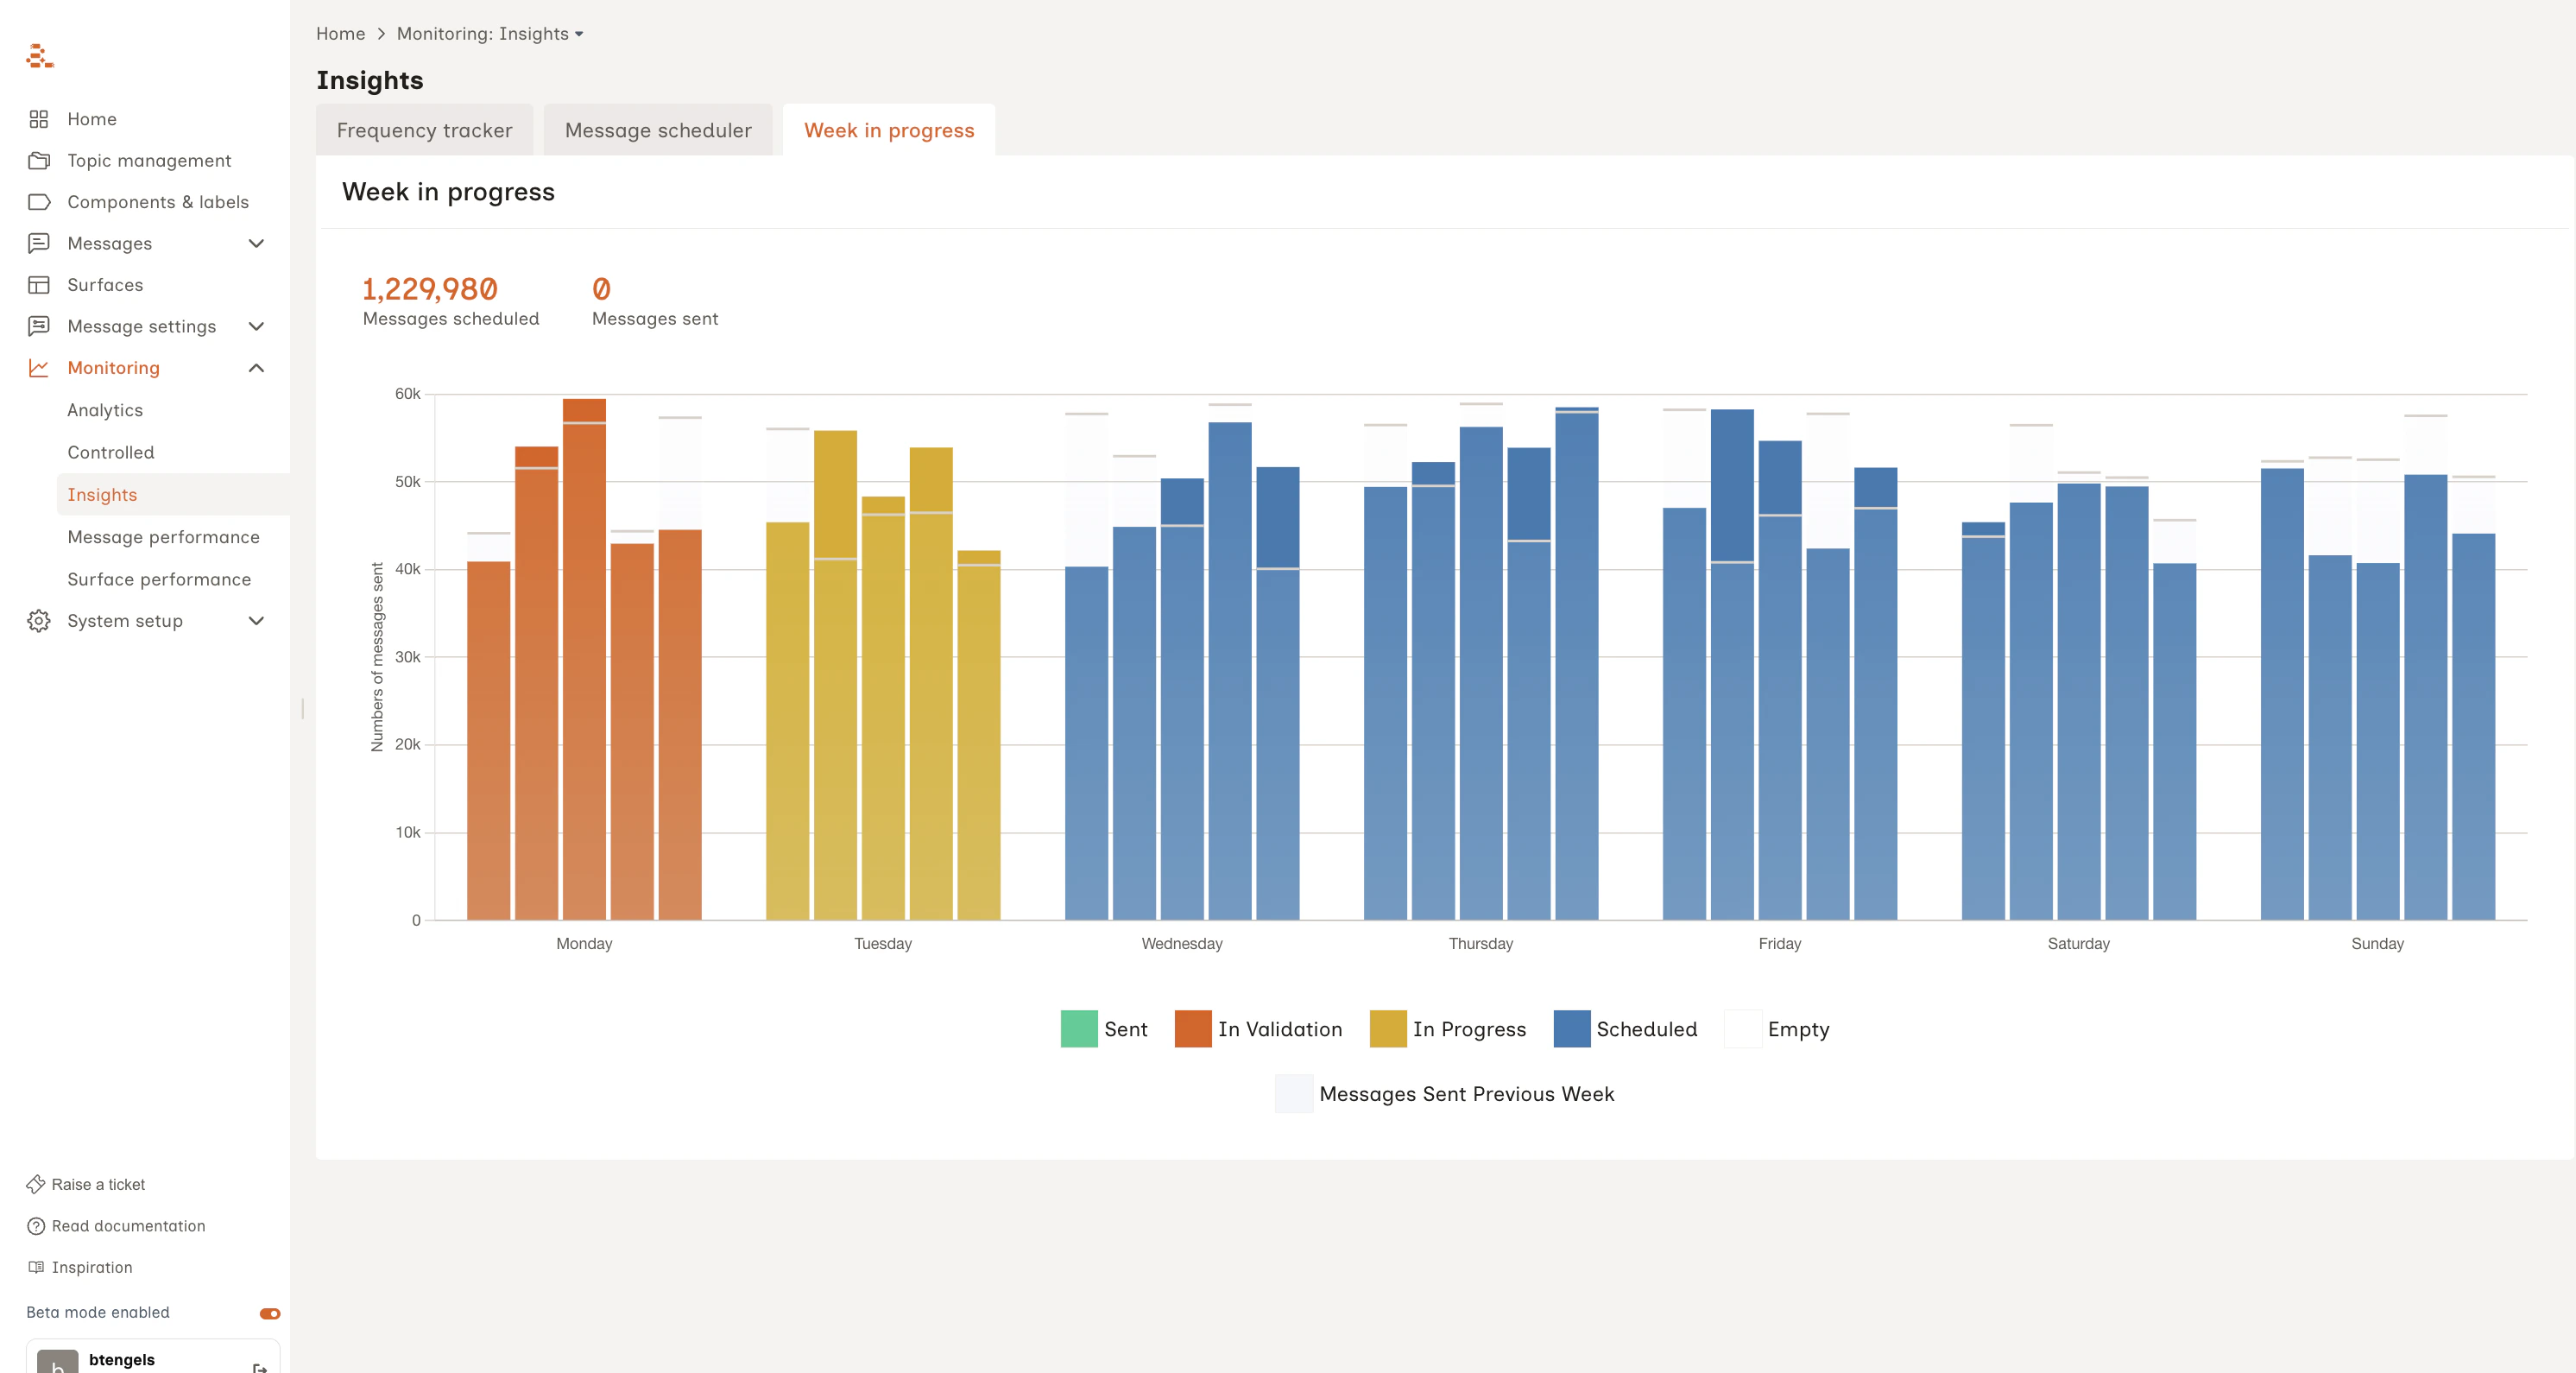
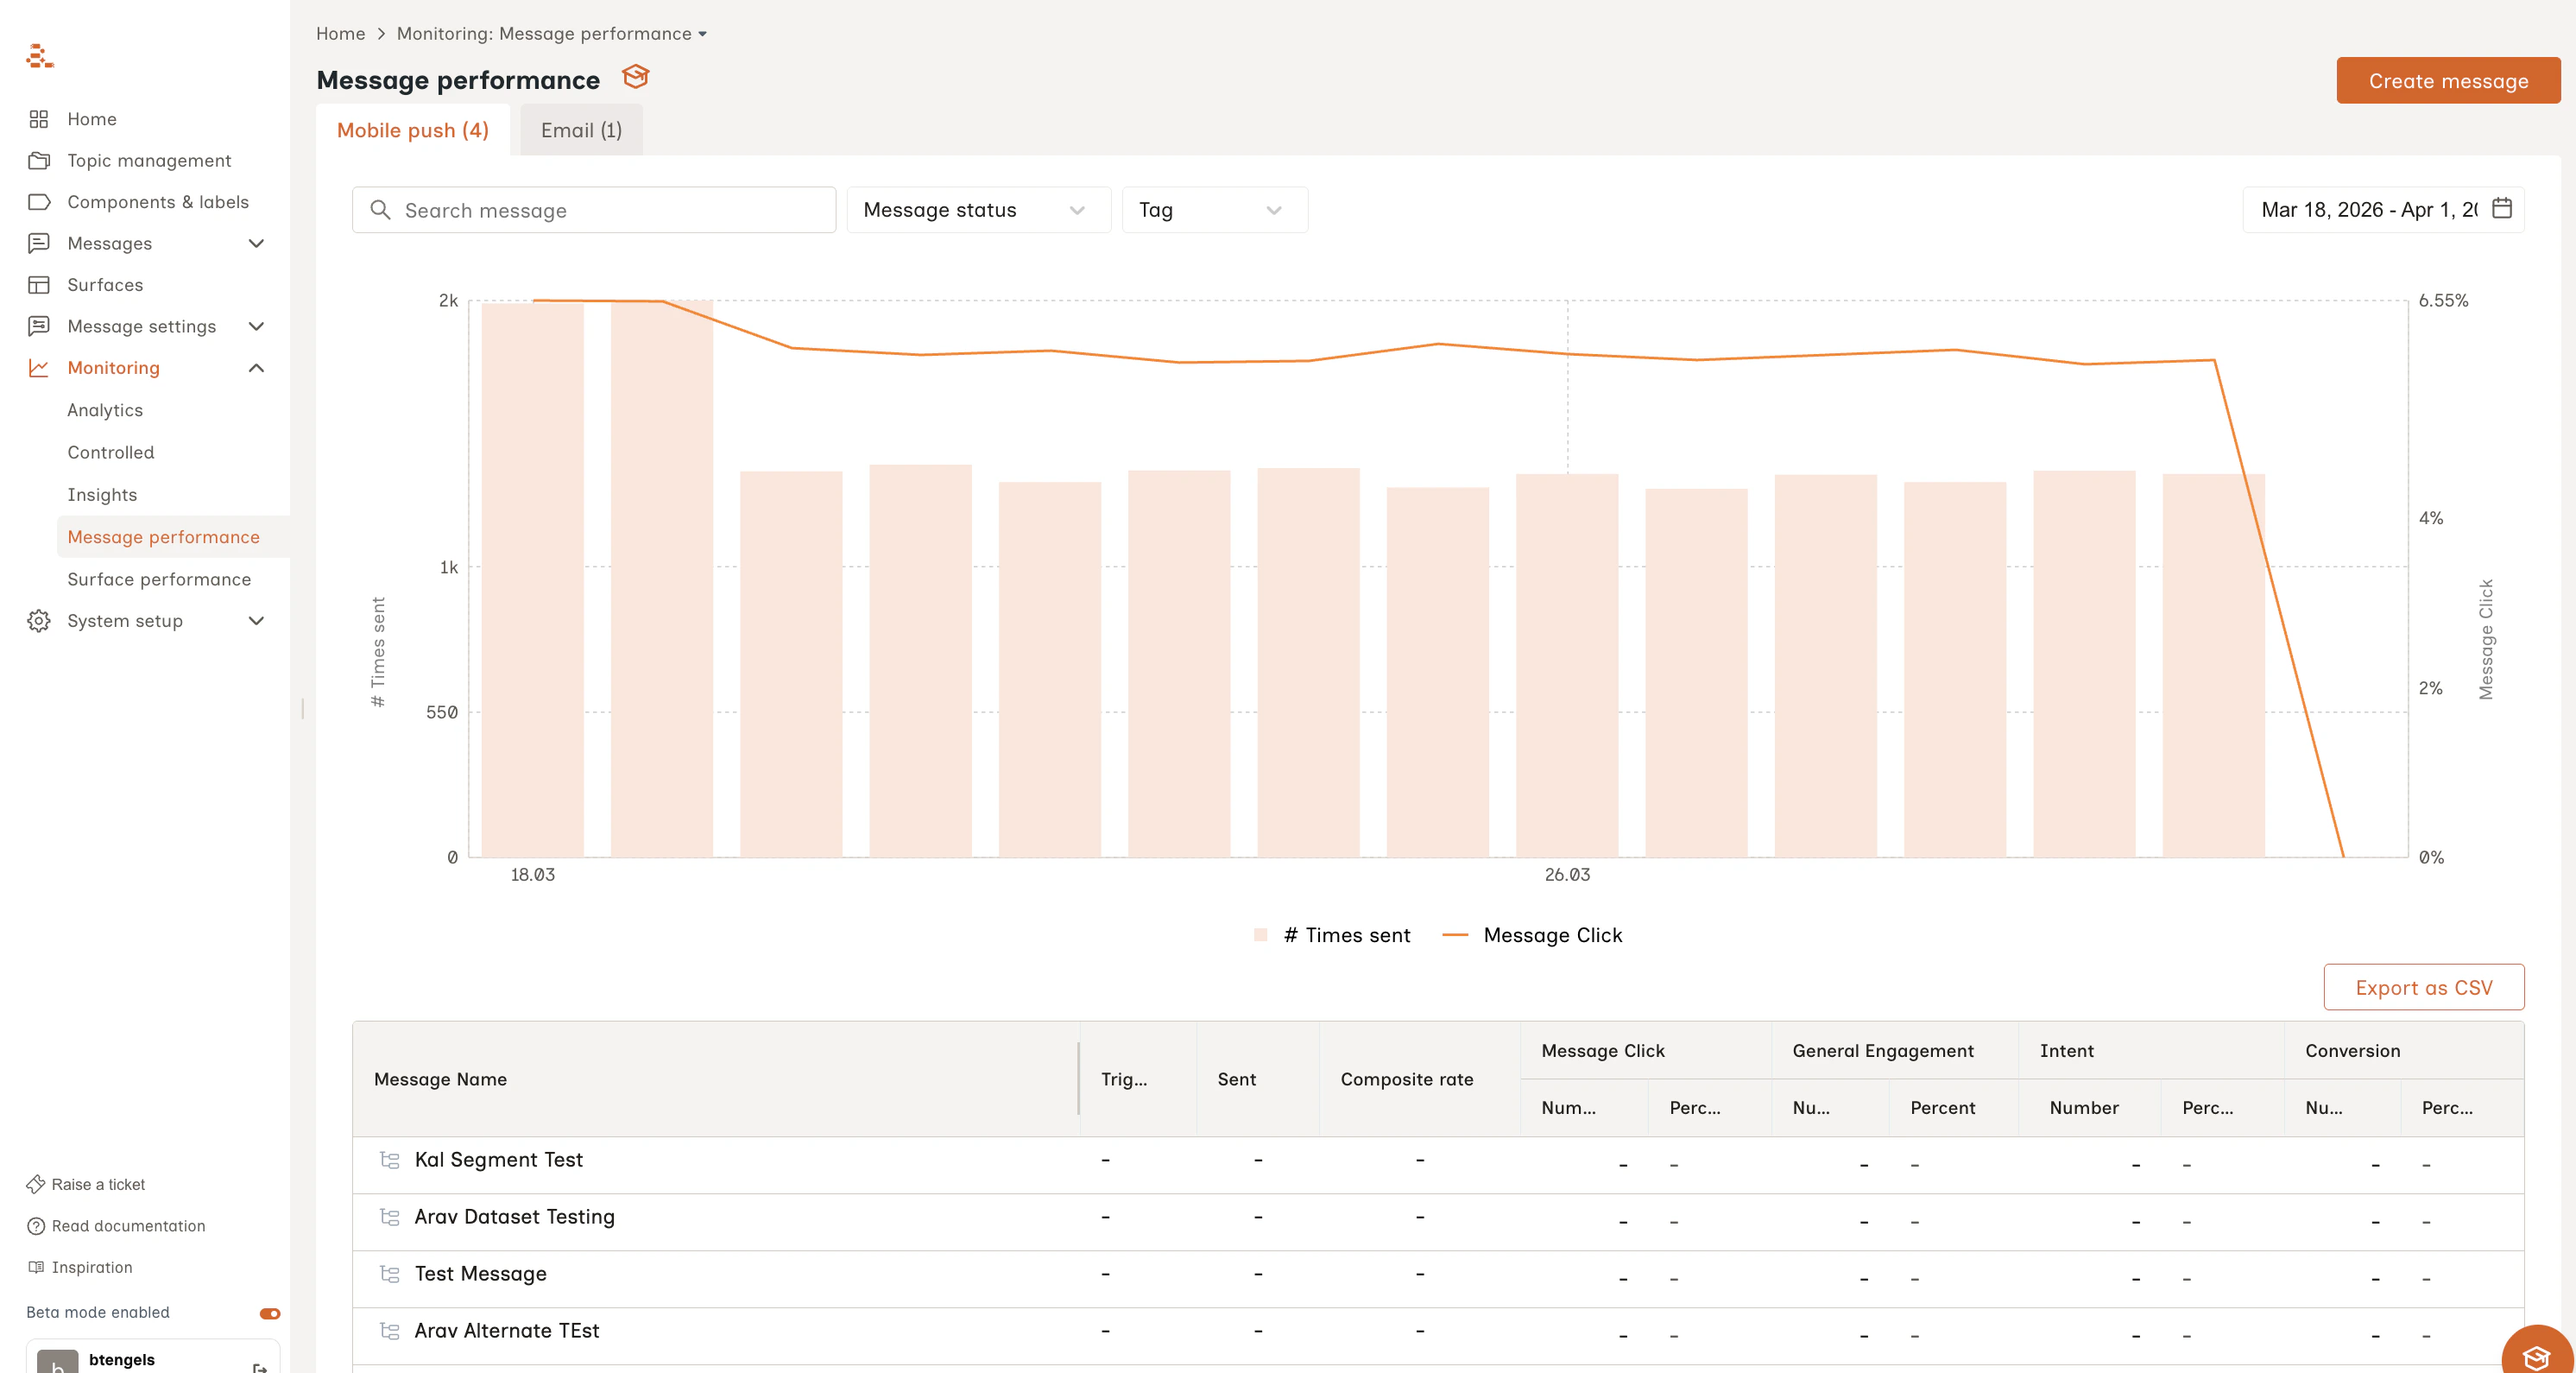
Message Performance
The Message Performance provides a way to compare the performance of individual messages and their outcomes. The initial chart shows (1) total messages sent by day and (2) the estimated click-through rate of those messages based on the customer event feed.You can filter the chart to specific messages or groups of messages using the search bar, tags, or message status menus.
The success metrics in the table below make use of the same attribution-window heuristic, but for any funnel event.
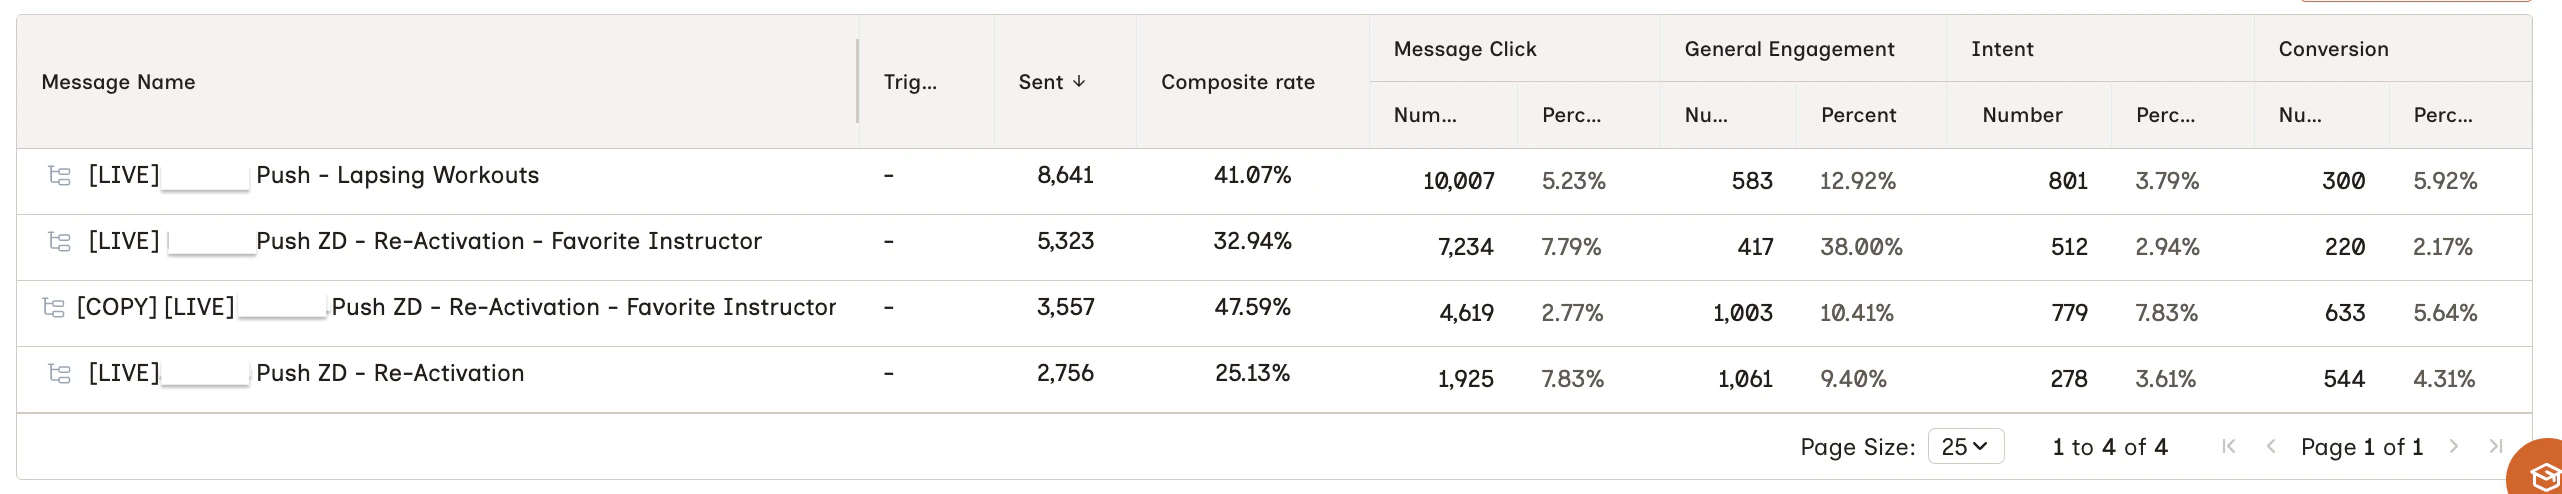
- What share of message events have any conversion event within the attribution window?
- What share of message events have any engagement event within the attribution window?
Surface Performance
For customers using Surfaces, the Surface Performance tab provides insight on each Surface message and important details about it’s delivery, consumption, and sucess.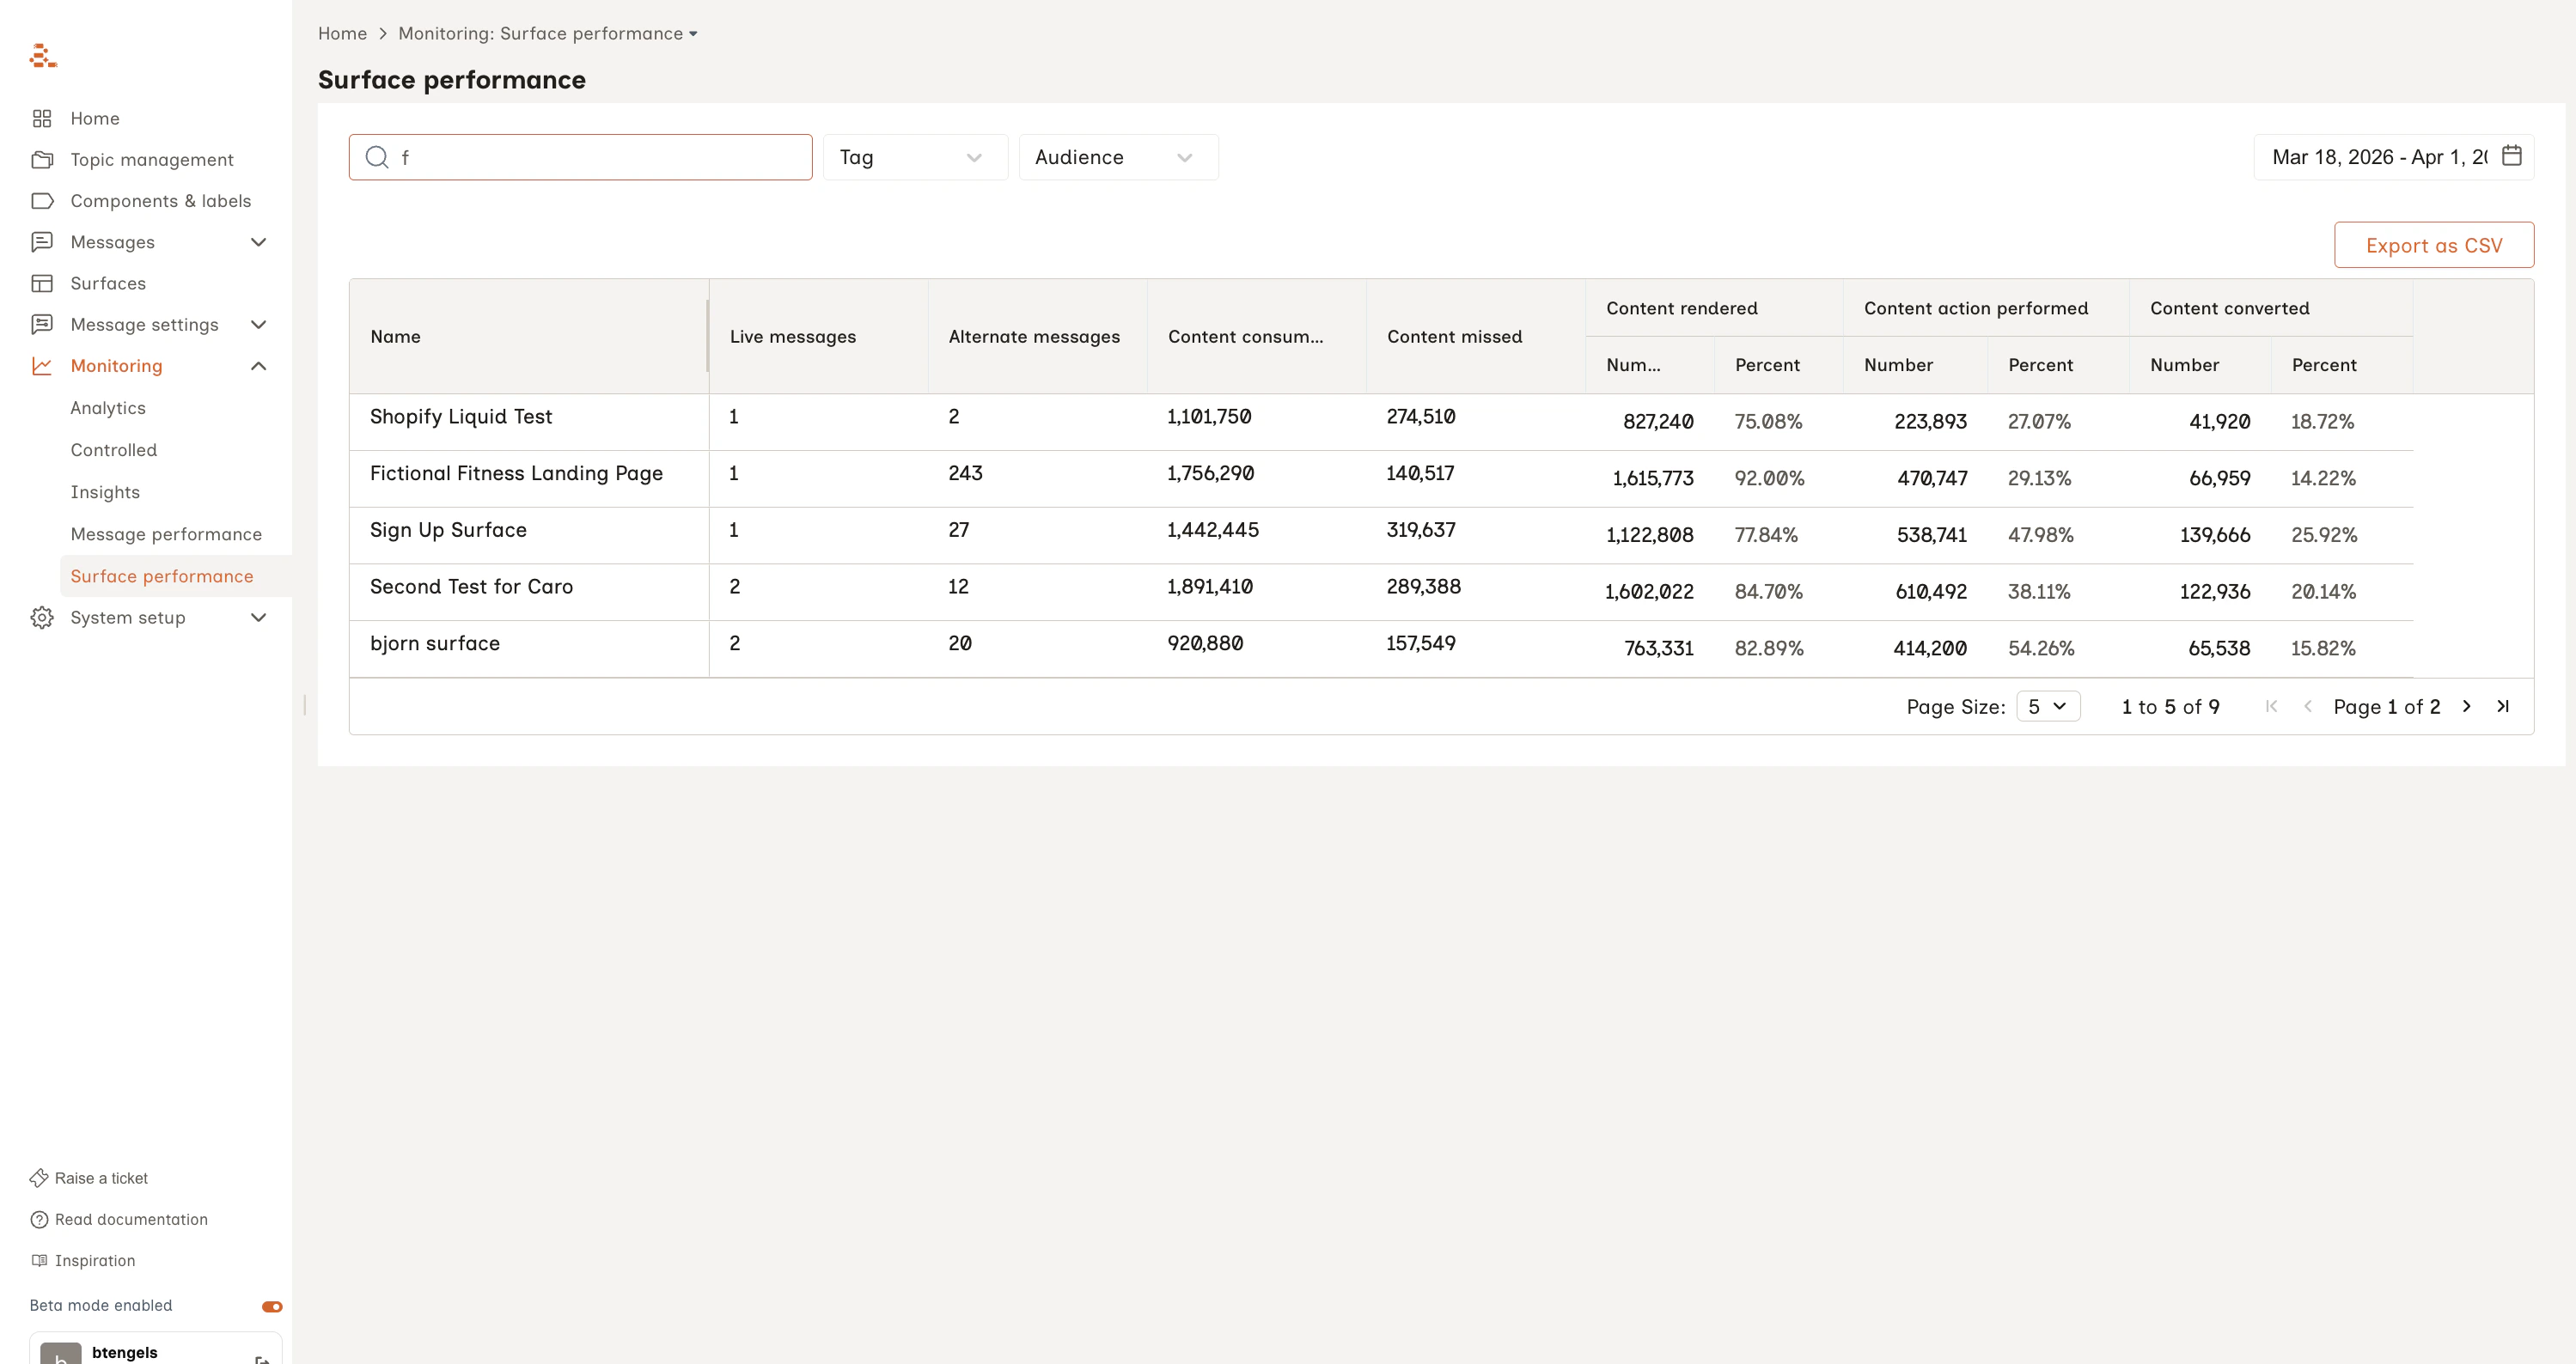
Attribution and Click Counting in Greater Detail
When analyzing message performance, Aampe follows specific rules of how clicks are attributed. Key points:
- For the sake of reporting, clicks make use of the message-send timestamp, not the actual click time.
- Only clicks occurring within 24 hours of the send are counted; any click after that window is excluded.
- If multiple messages could plausibly receive credit, Aampe shares or reduces attribution weight across them.
- Data may take up to 24 hours to fully settle, due to ingestion and processing lag.