What You’re Looking At
The grid represents pairs of Labels from two different Components (for example, Offering and Value Proposition).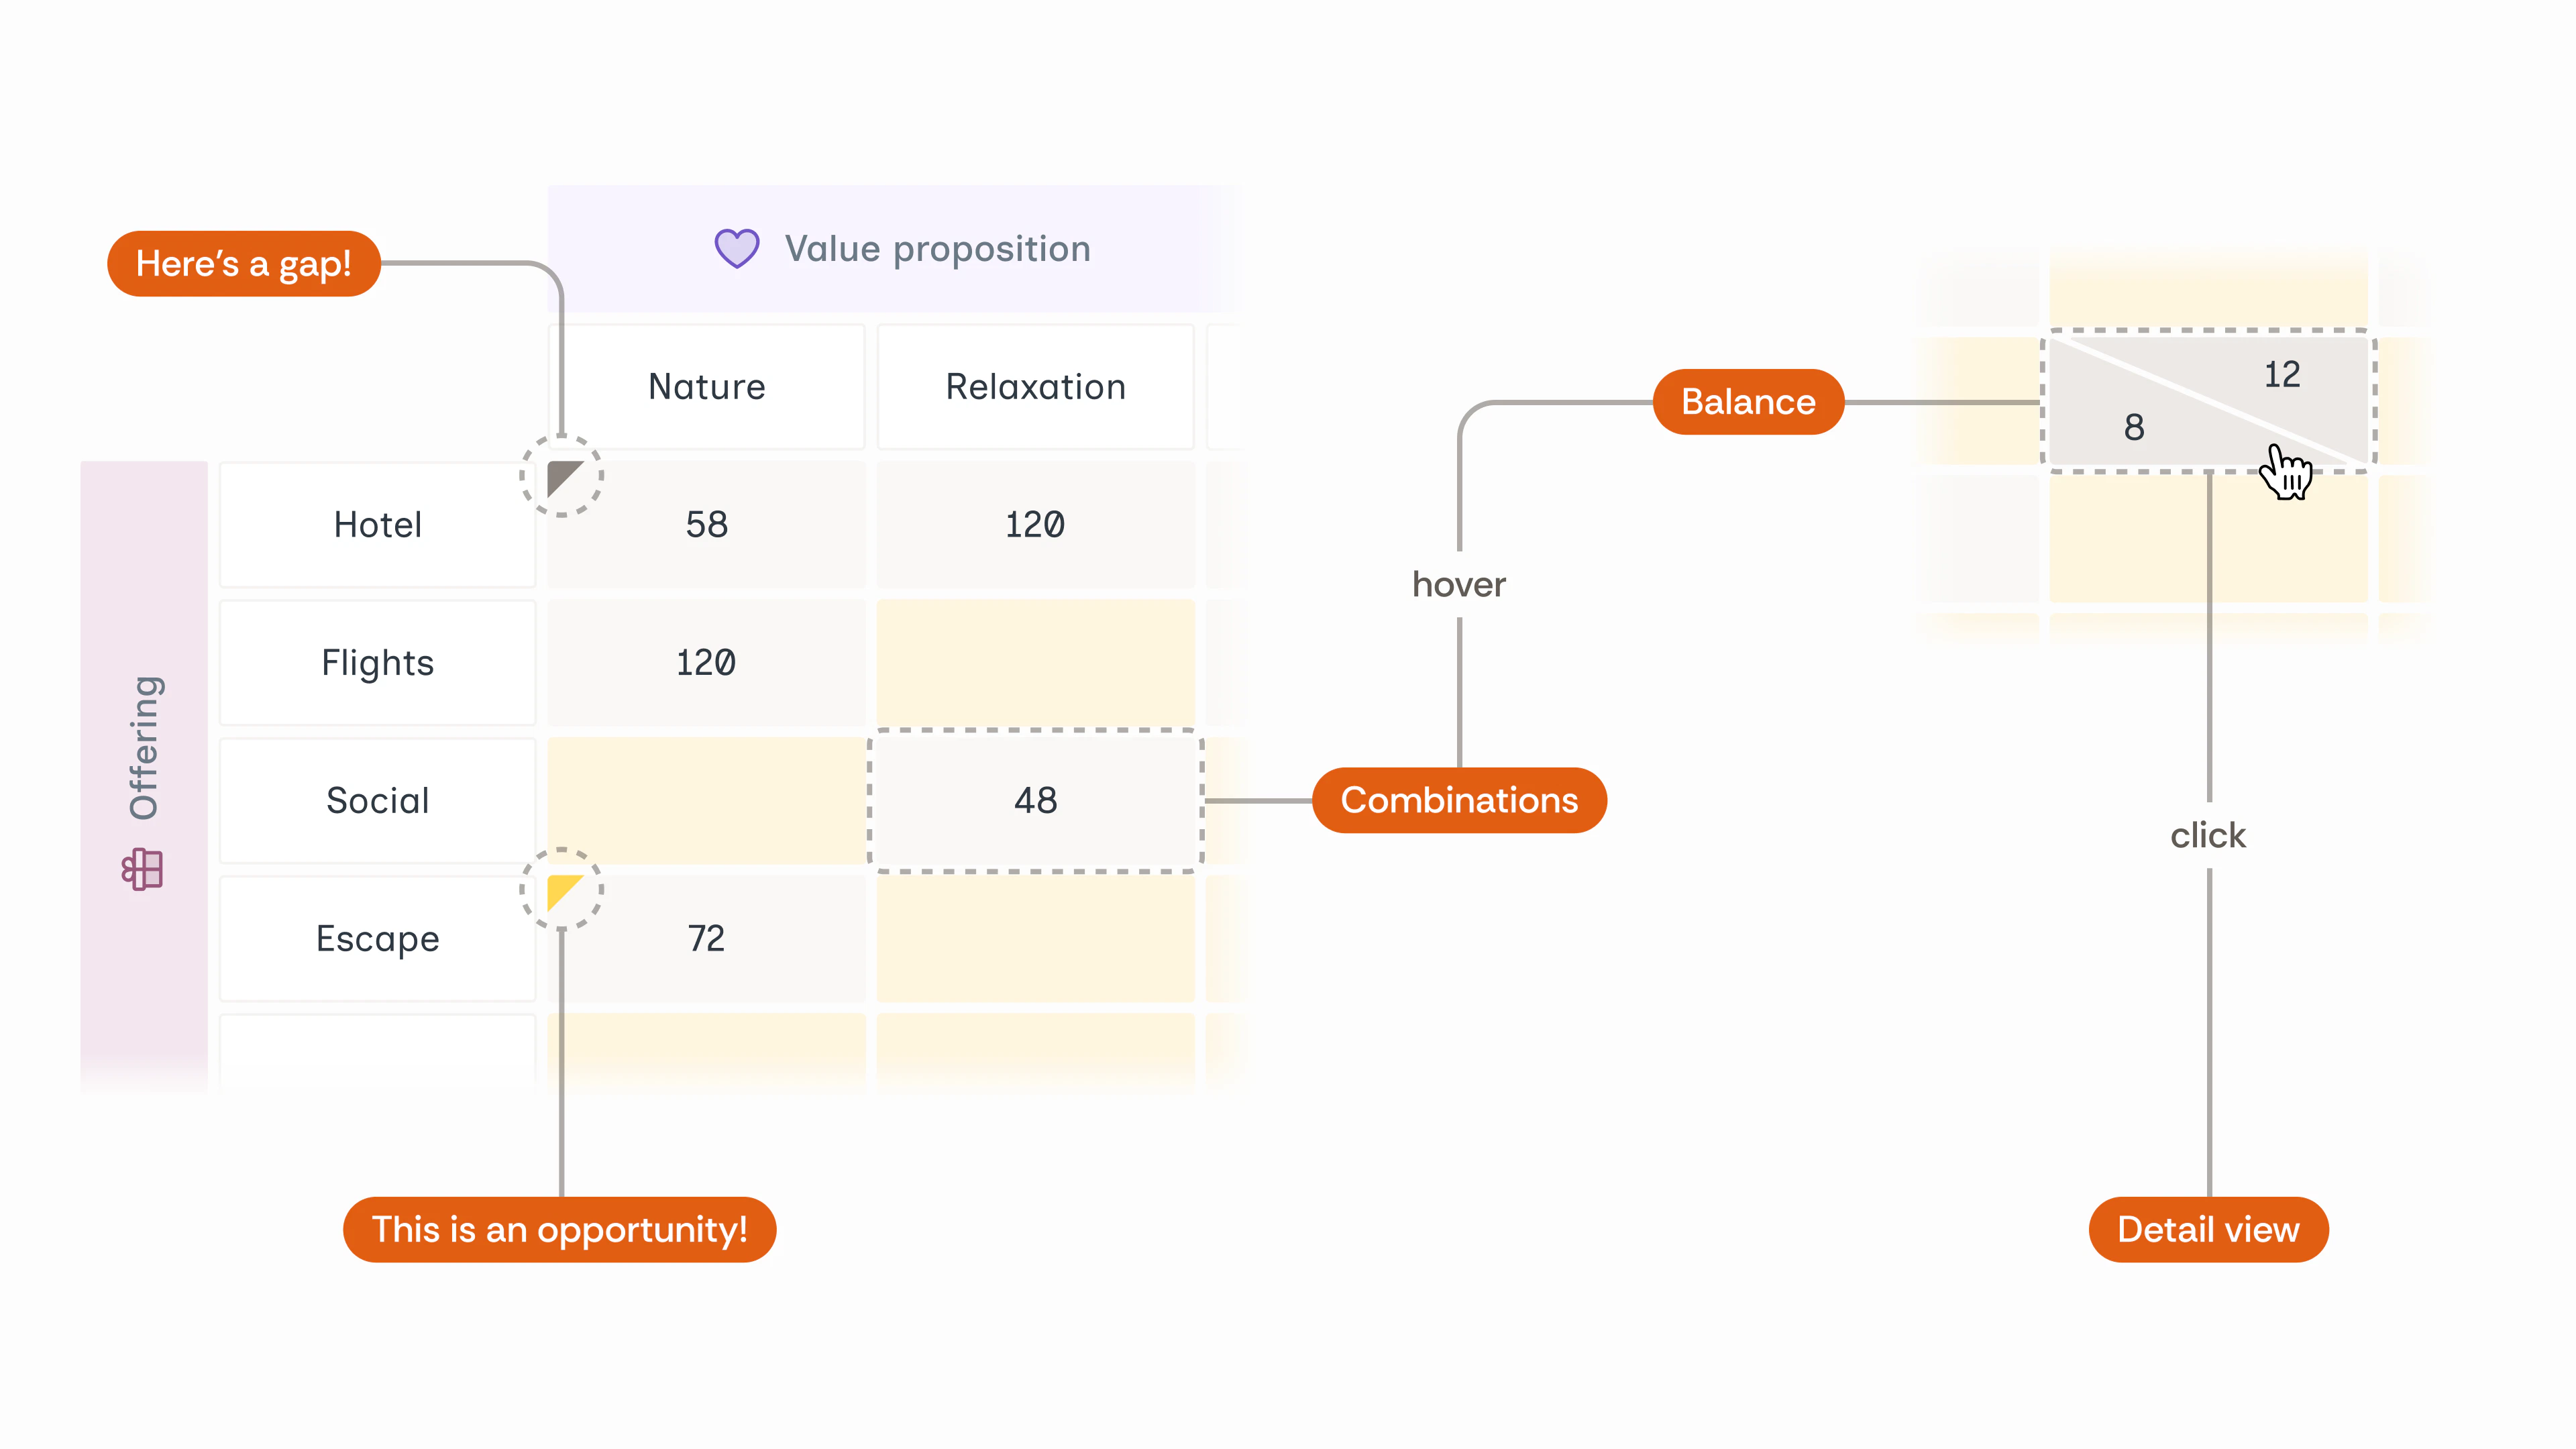
- Rows represent one Component (e.g., Offering).
- Columns represent another Component (e.g., Value Proposition).
- Numbers in the cells show how many possible Alternate combinations exist between the two Labels across all Message groups where they appear together.
- Coloured triangles in the cells highlight content gaps or content opportunities.
Grey Gaps
Yellow Opportunities
If you see “ML” anywhere against a Label, that means that Label is applied at a Message group-level.
Key Metrics
Combinations
Combinations represent the total number of possible Alternate pairings between two Labels, summed across all Message groups where those Labels appear together. This also includes Labels which are applied at a Message group-level. The higher the number of combinations, the better. It means that there’s more variation possible within those Messages.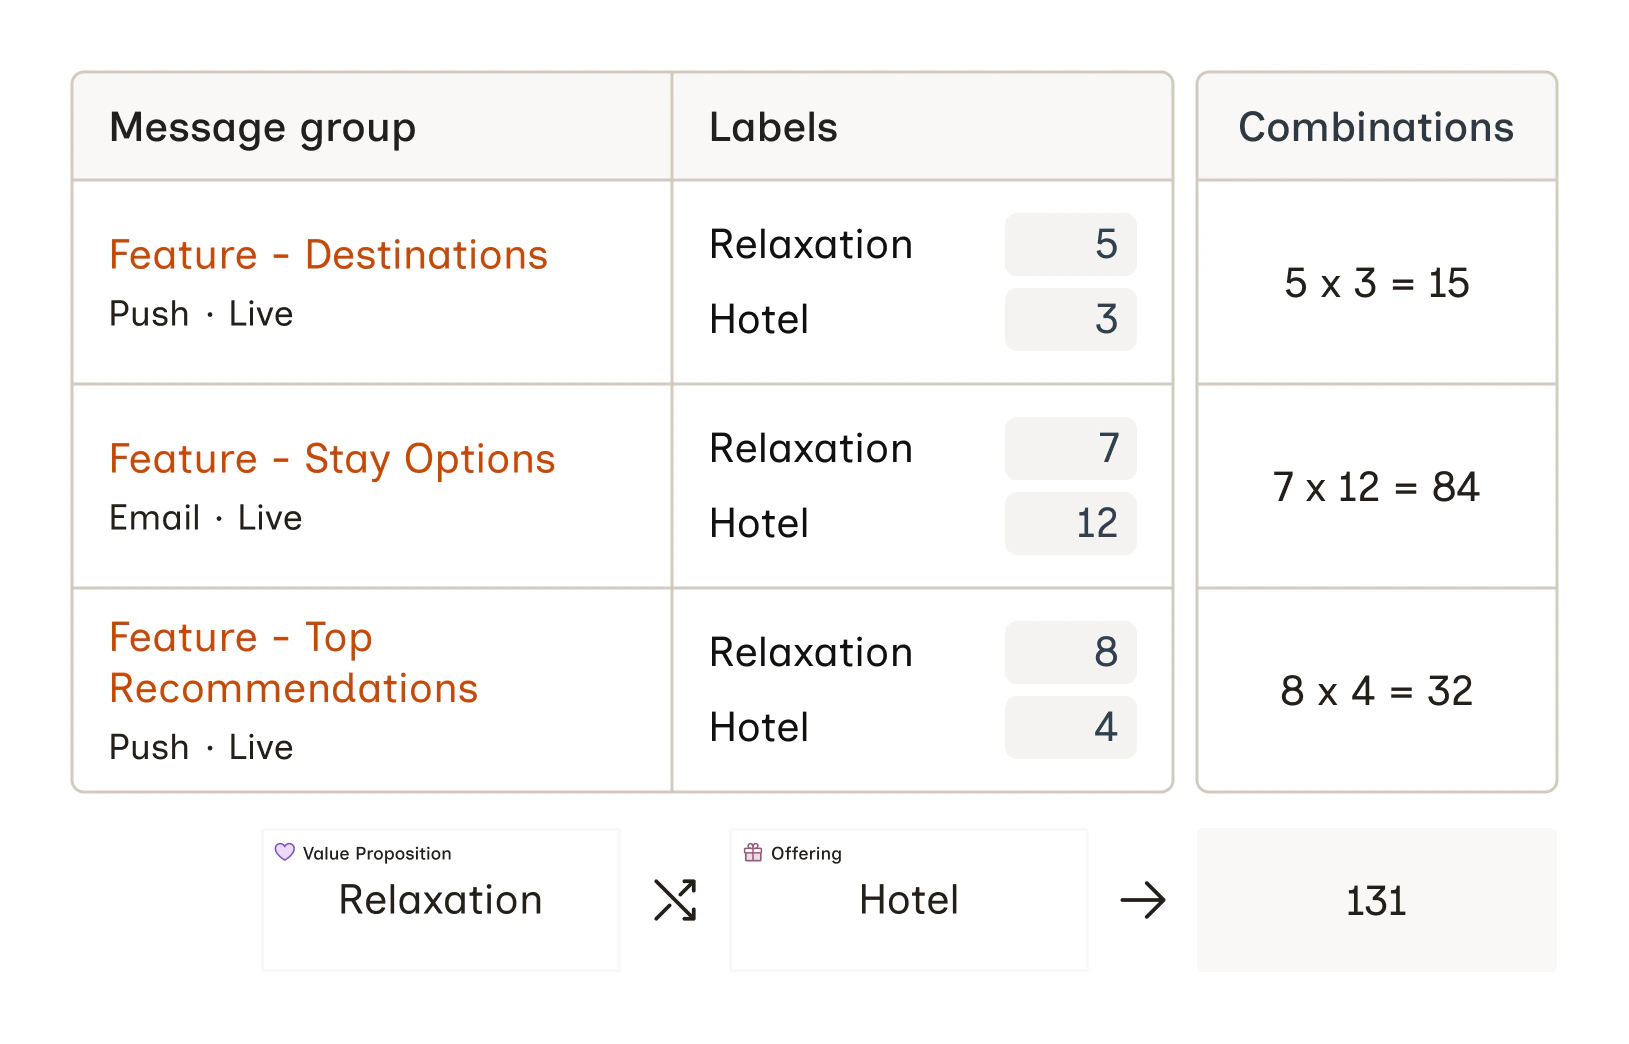
Balance
Balance shows how evenly Alternates are distributed between the two Labels in a pair, and can be viewed by hovering over a cell. If one Label has significantly more Alternates than the other, it indicates an opportunity to add more content for the underrepresented Label.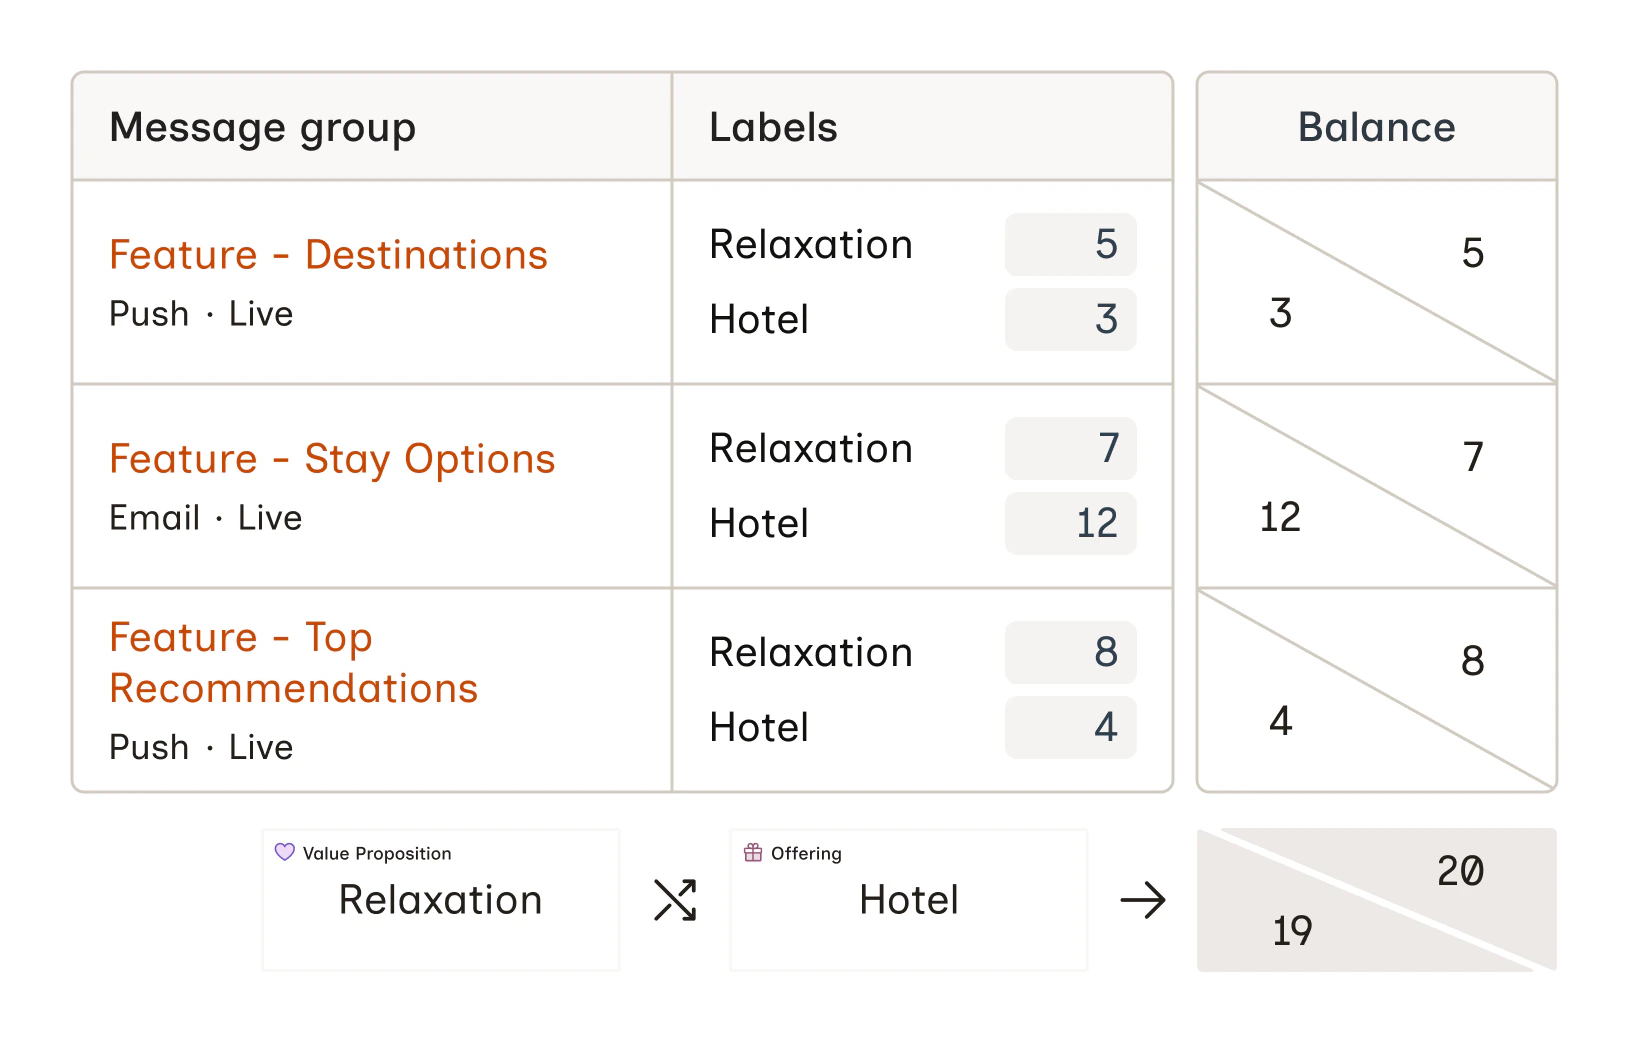
Gaps
A gap appears when a Message group contains fewer than three Alternates for a given Label. These are areas where content variety is low and can benefit from adding more variations. In the grid, these are marked with an gray triangle.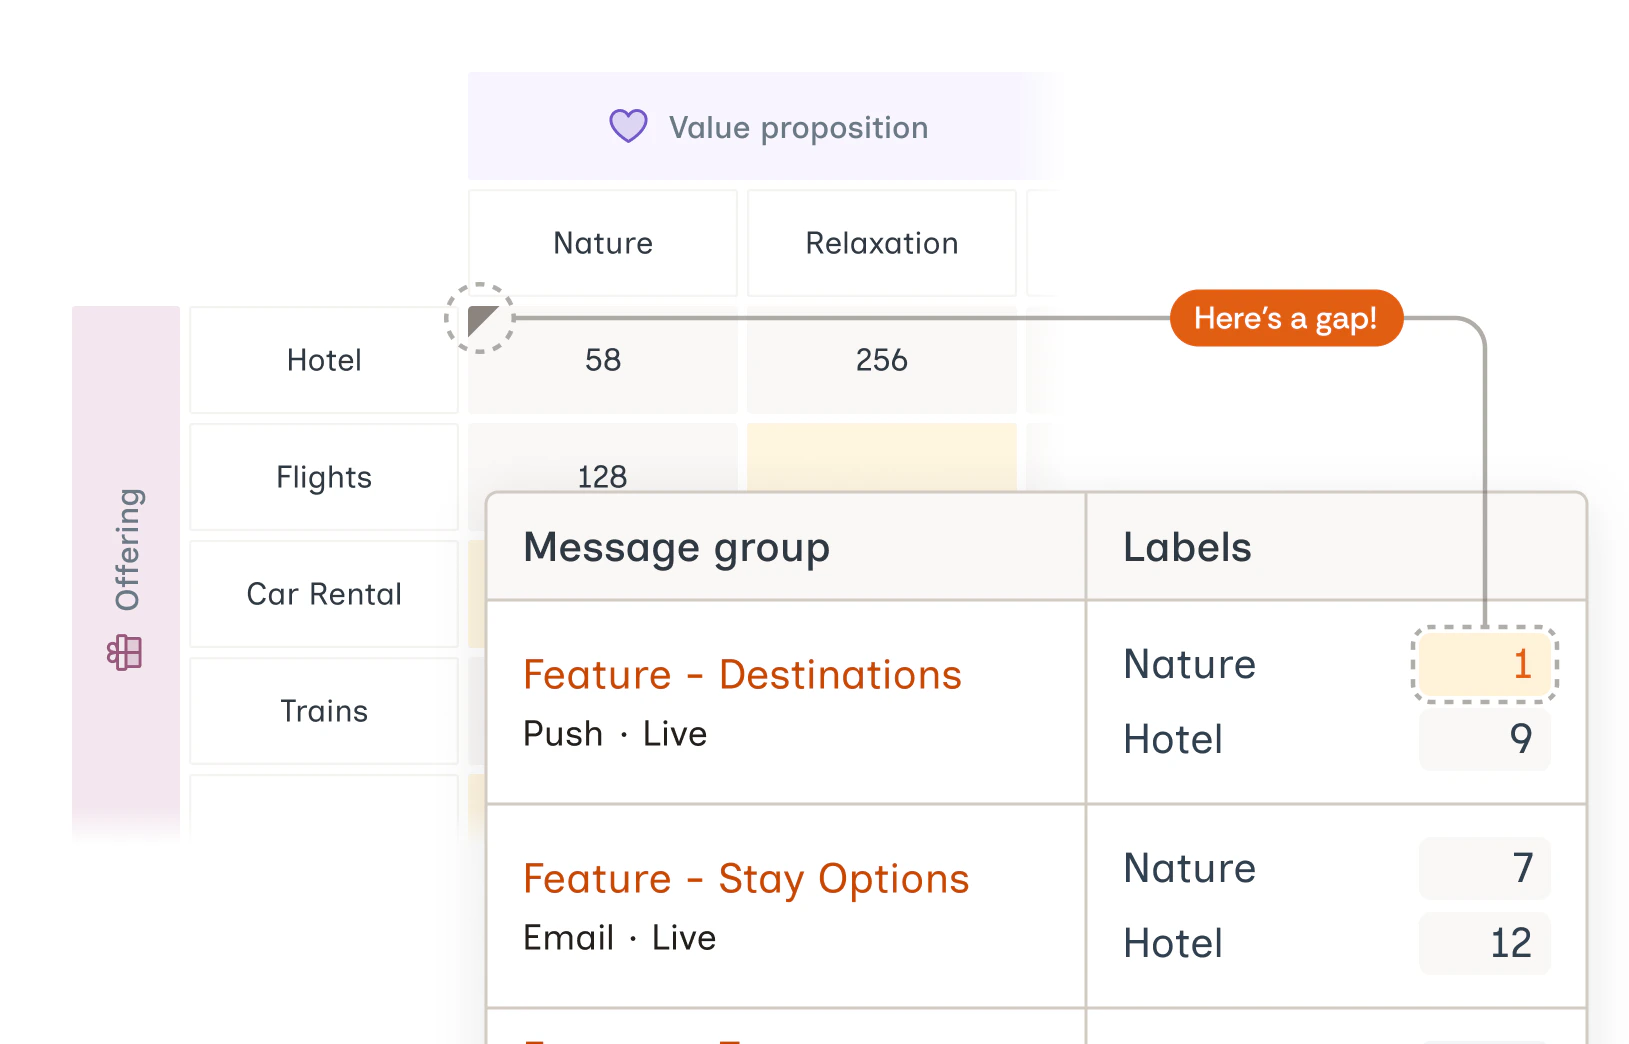
Opportunities
An opportunity appears when both Components are used in a Message group, but only one of the selected Labels is present. Opportunities are indicated with a blue triangle. These are cases where a Label combination hasn’t yet been explored — adding Alternates for the missing Label can create new combinations. Additionally, Message groups where both Components appear but neither of the Labels are used are also classified as opportunities. These appear lower in the Opportunities table in the Detail view, and if only such opportunities exist for a Label pair, the blue triangle indicator is not shown in the grid.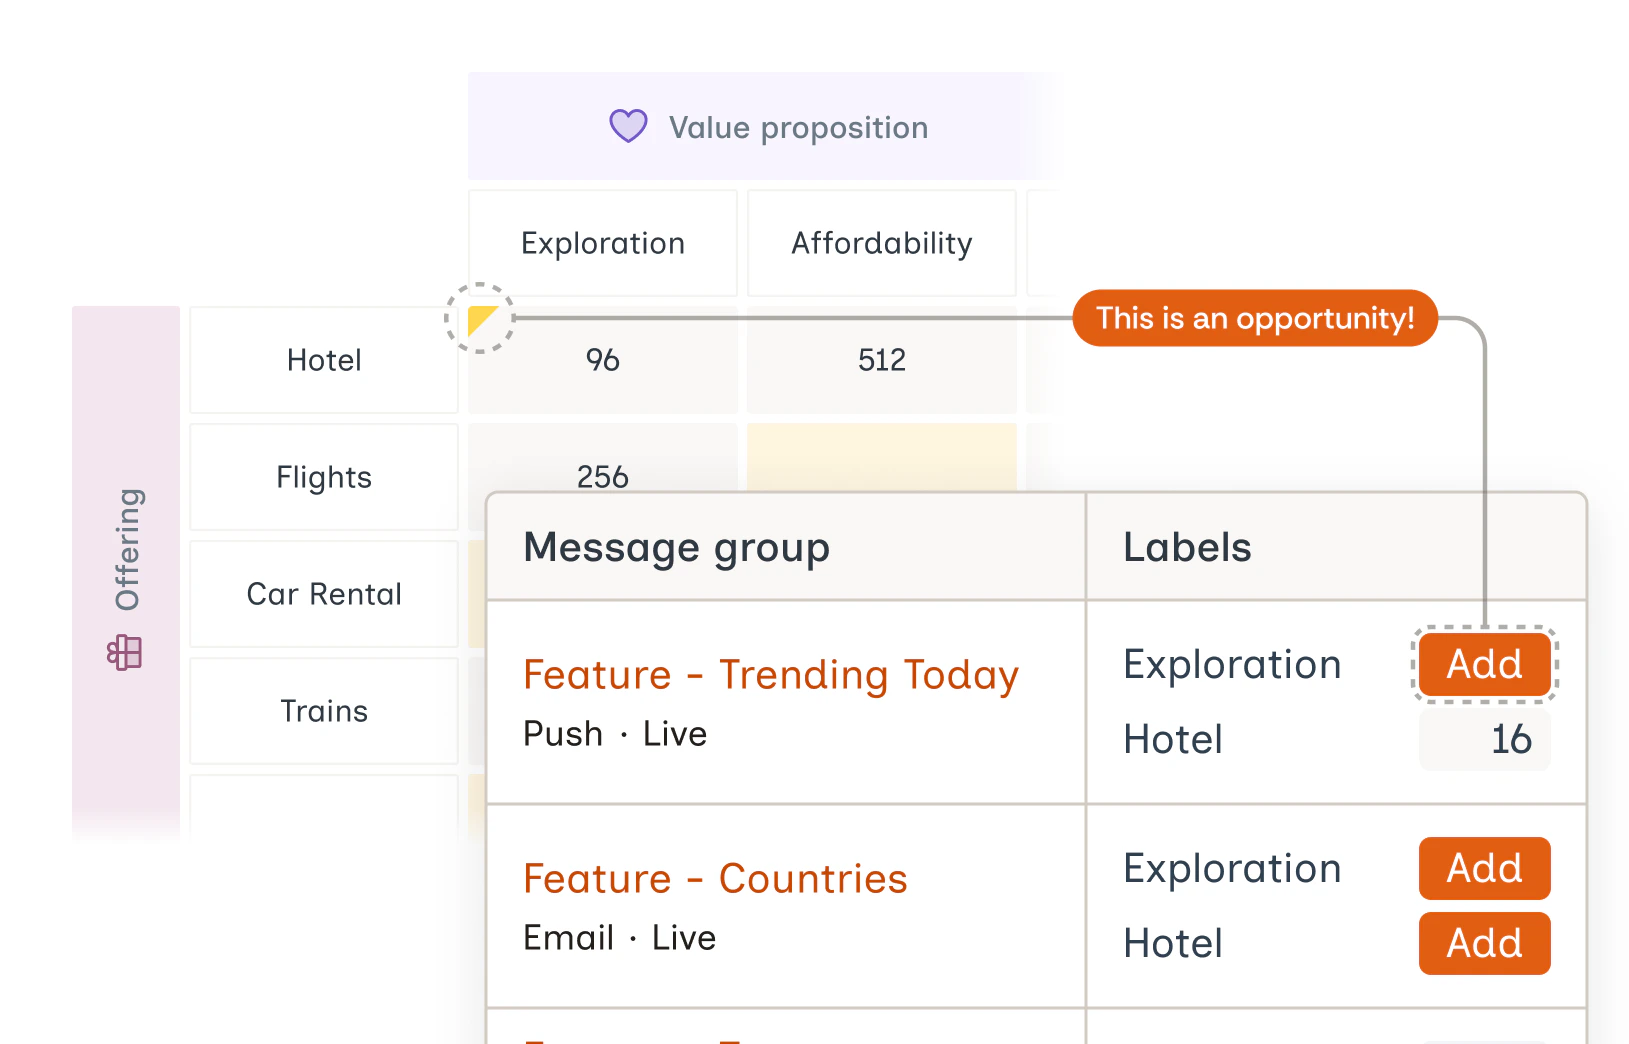
Blank Cells
Blank cells represent Label pairs that haven’t yet appeared together in any Message group.- These cells are clickable and open a Detail view.
- Since there are no associated Messages, only the Opportunities table is visible.
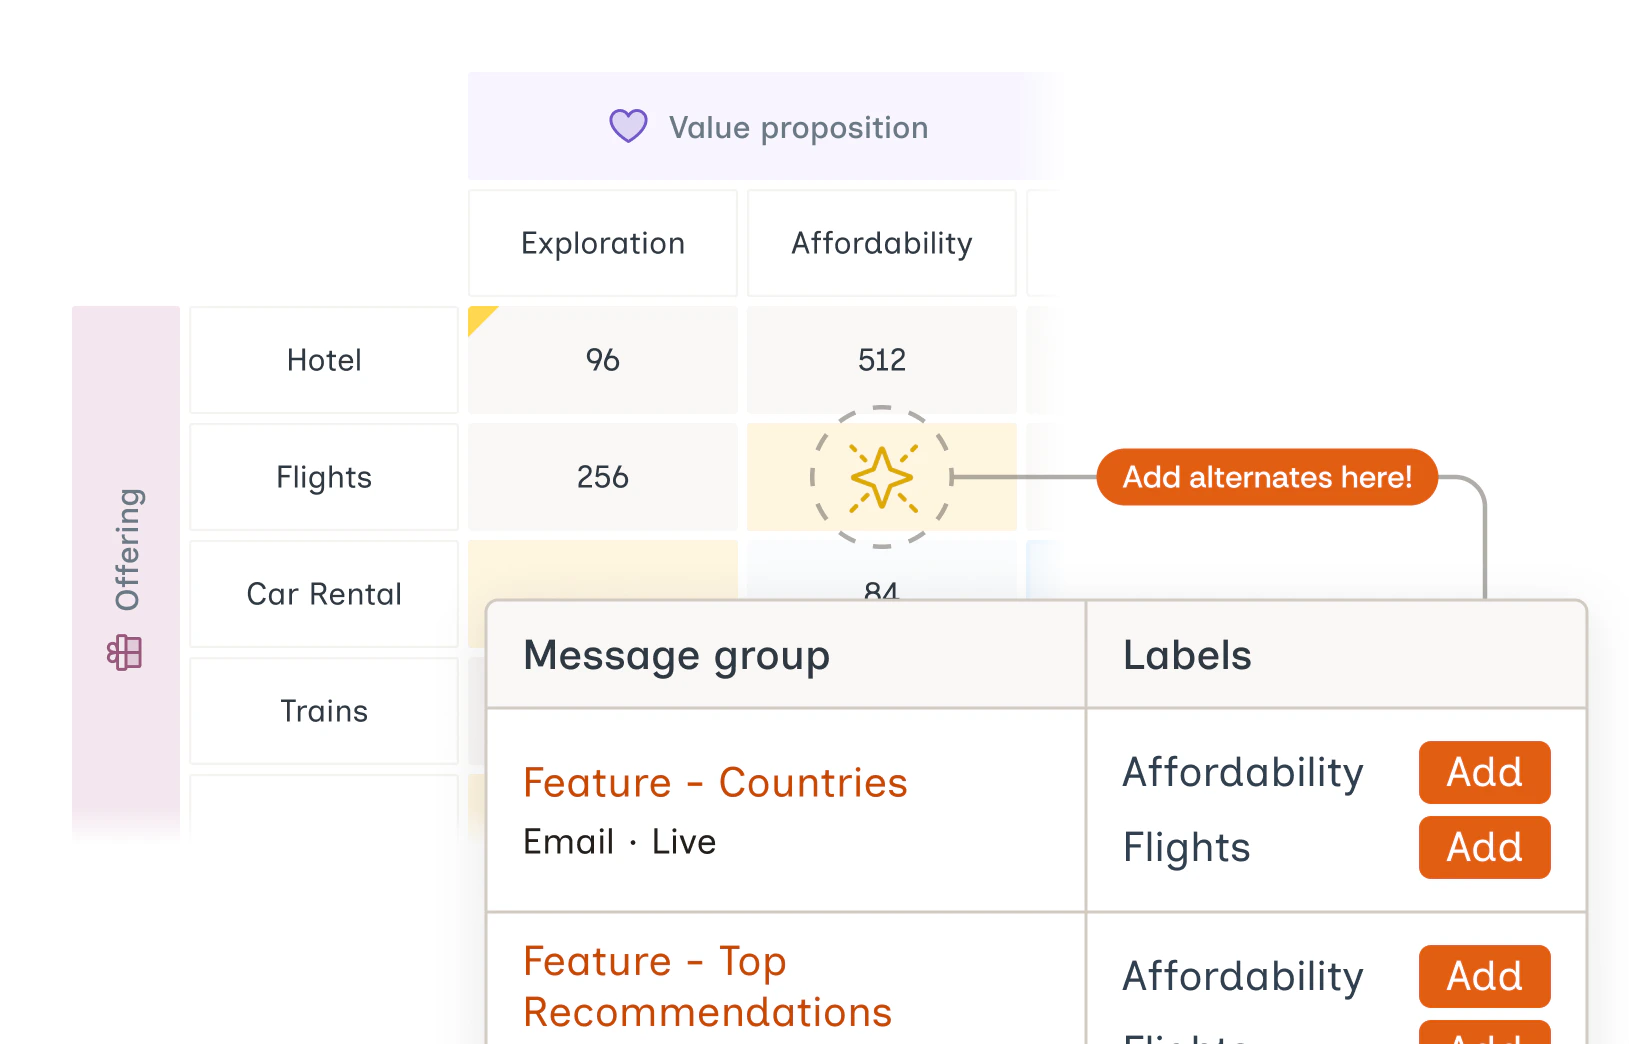
Detail View
Clicking on any cell opens a detailed view showing:- The list of Message groups where the selected Label pair co-occurs
- Highlighted Gaps (in orange) for Message groups with less than three Alternates for a Label
- Counts of Alternates and their distribution (balance)
- Table for Opportunities
How to Use These Insights
- Fill gaps by adding more Alternates for Labels with fewer than three.
- Explore opportunities by adding missing Label combinations to expand message variety.
- Use blank cells to identify new, unexplored Label pairings that could enhance coverage.